ConductVision Software – Fear Conditioning

Contents
- Install and Run Application
- 1.1 Software Components
- 1.2 Machine Requirements
- Maze Types
- Experiment Configuration
- 3.1 New Experiment
- 3.2 Configure Stimulus Protocol
- 3.3 Configure Video Tracking
- Video Service Connection
- Experiment Run
- 5.1 Run Experiment
- 5.2 Result Tables
- 5.3 Video Replay
- 5.4 Main Steps
- Conduct Adapter
- 6.1 Conduct Adapter Software Installation
- 6.2 Start ConductAdapterUI
- 6.3 Execution Status on ConductAdapterUI
- 6.4 Fear Conditioning Commands
- 6.5 Manual Operations
- 6.6 TTL
- 6.7 Conduct Vision Simulator for Testing
- Multiple Cages
- Properties
- Animal
- Export Data
- Troubleshooting
- 11.1 Log Display
- 11.2 Database Files and Media Data
- License
- Camera Setup
1. Install and Run Application
1.1 Software Components
The software consists of three main folders:
- ConductVisionF\ConductVisionPy - Contains AI-based tracking service executables and libraries that users would not need to interact with directly
- ConductVisionF\ConductVisionUI - Main application executable
- appFearCondition\bin - Contains ConductAdapter software for communication between ConductVision video tracking system and Fear Conditioning Hardware system
To launch the application, double click on the executable: ConductVisionUI\bin\ConductVisionUI
The application appears as shown below:
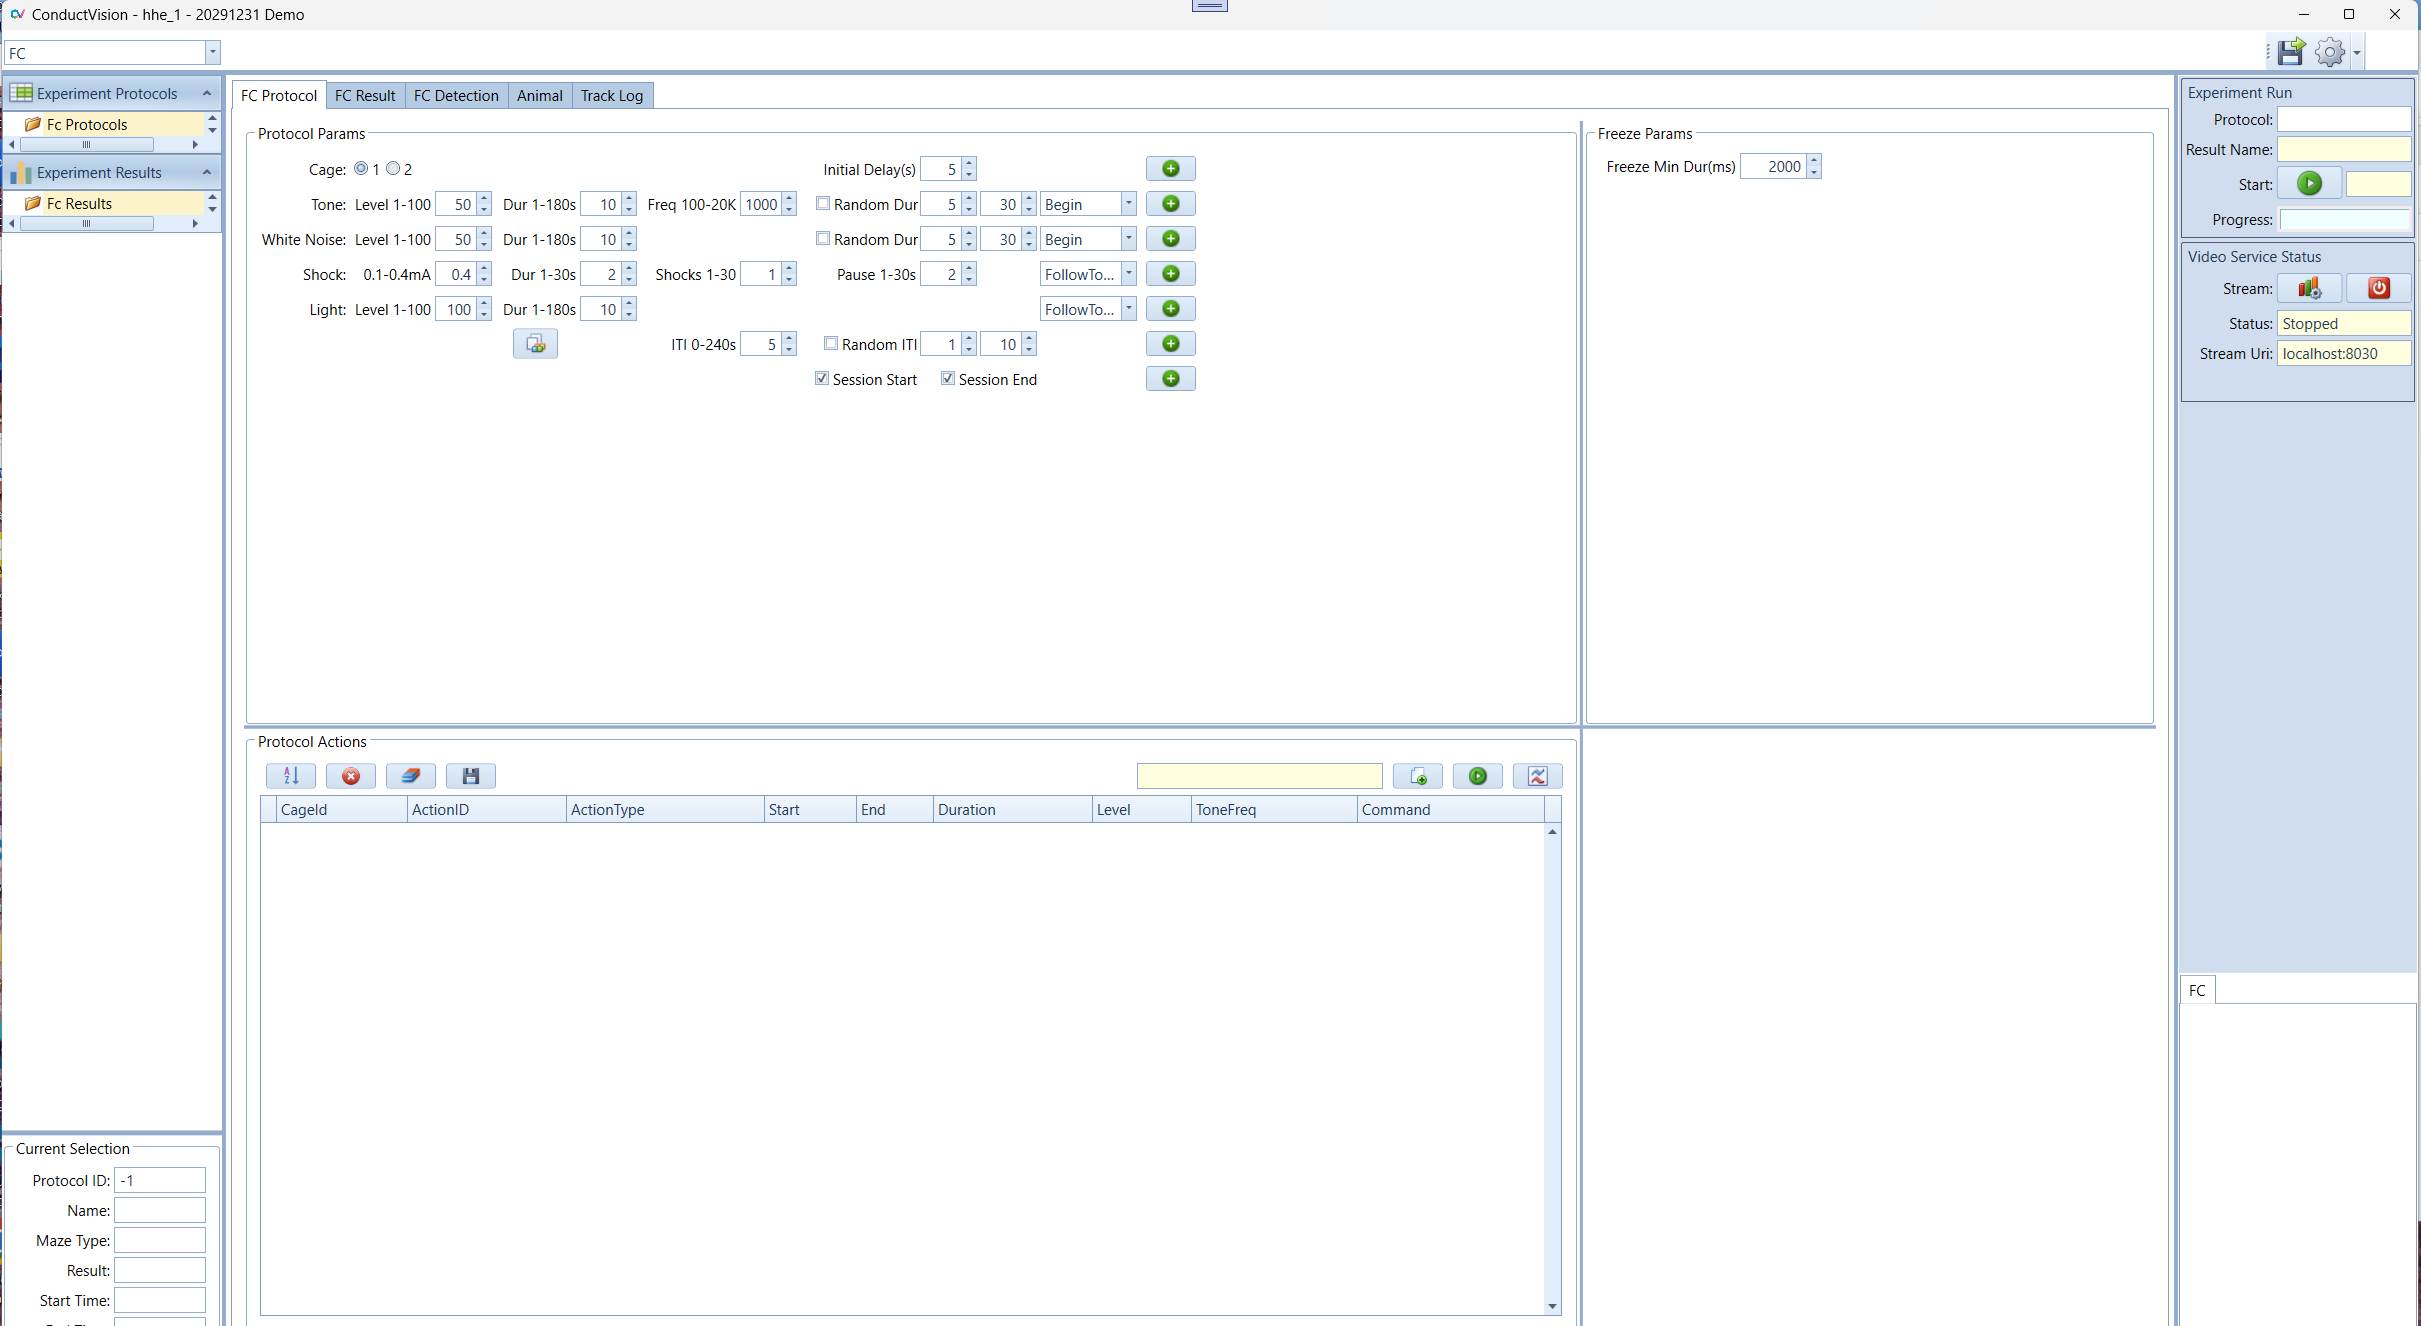
The application uses image buttons extensively. Tooltips appear when hovering over UI elements.
1.2 Machine Requirements
Since the application is a GPU-based AI application, it extensively uses Deep Learning Framework, GPU programming, and AI libraries.
We recommend a desktop or laptop with NVIDIA RTX series such as RTX 3090 or RTX 4060. Please contact our support for the recommendation of the latest GPU machine.
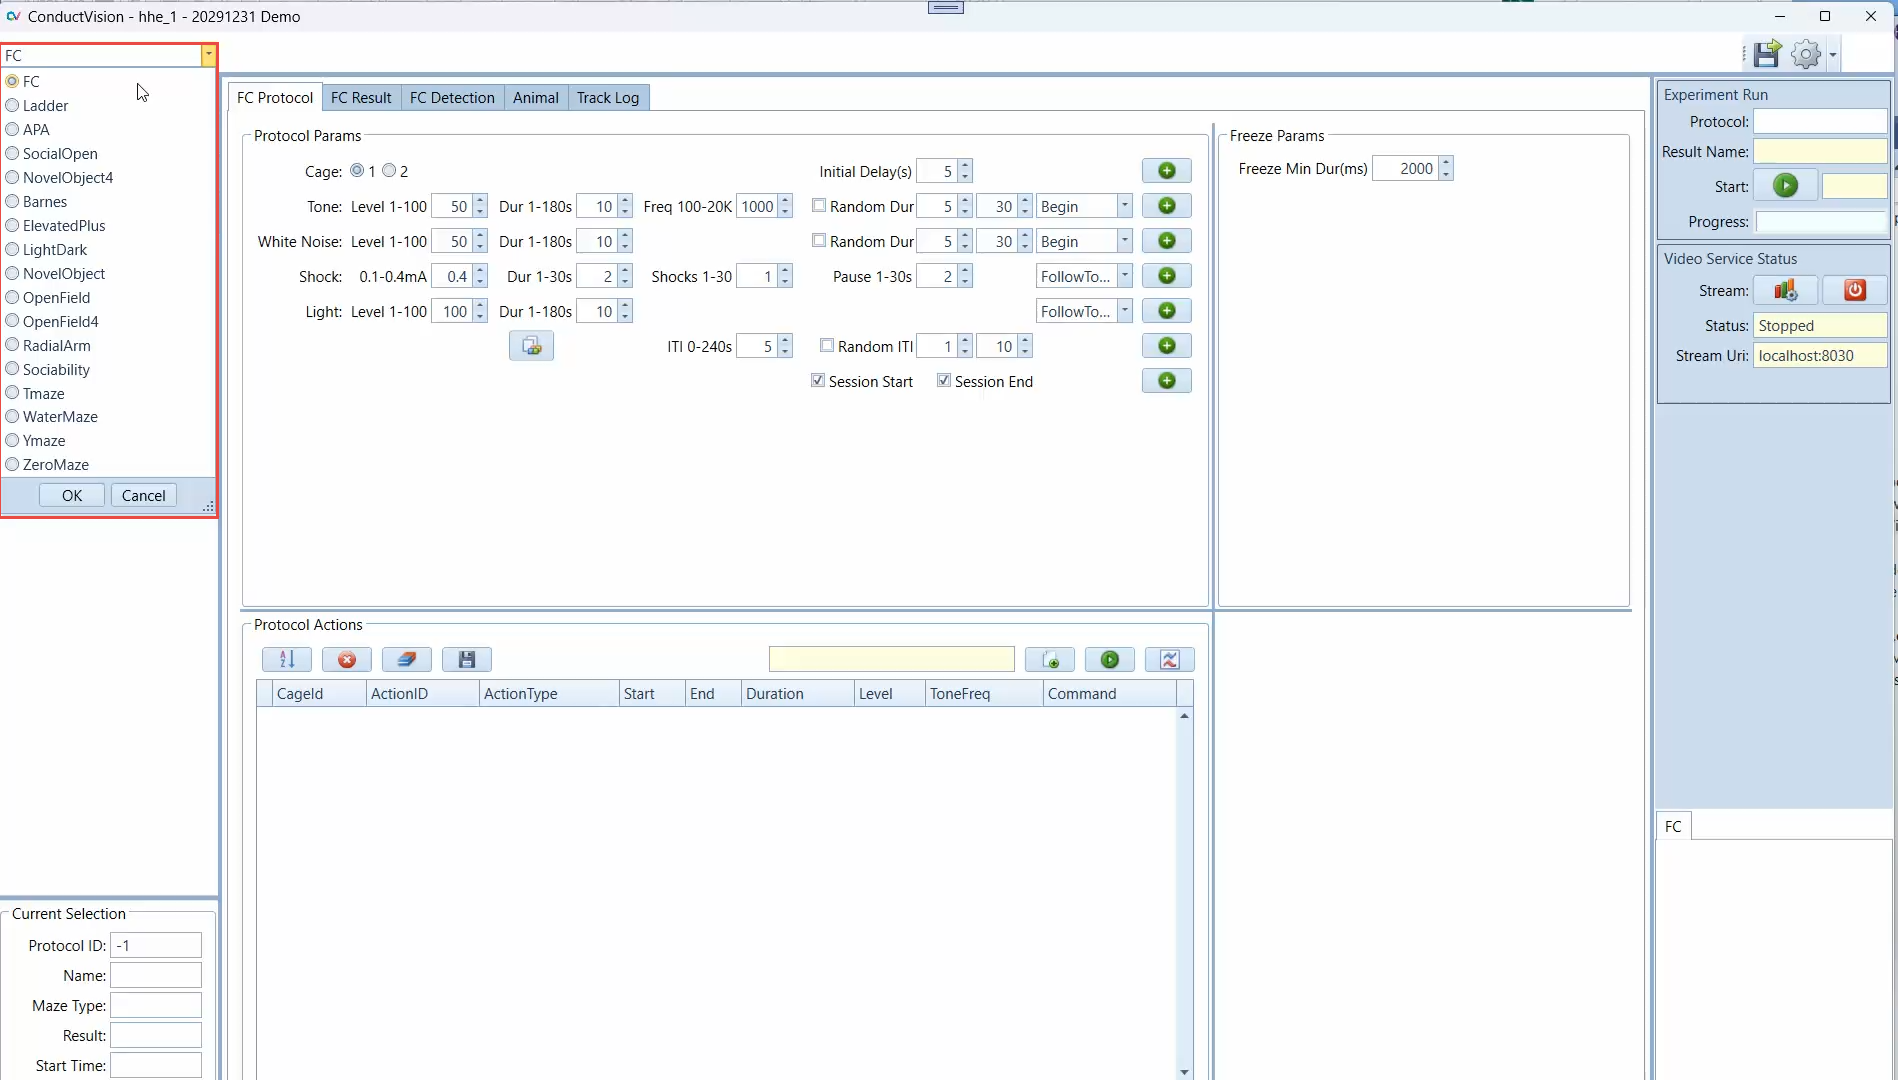
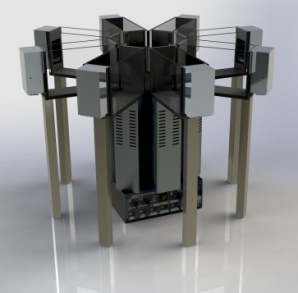
2. Maze Types
Click on the maze type field to view or select a maze type. You can switch to another maze without having to restart the application.
The available maze types are defined in the rodent package the user purchased. There are more advanced packages available.
3. Experiment Configuration
The application provides a user interface to configure and execute experiments (protocols) and view execution results.
3.1 New Experiment
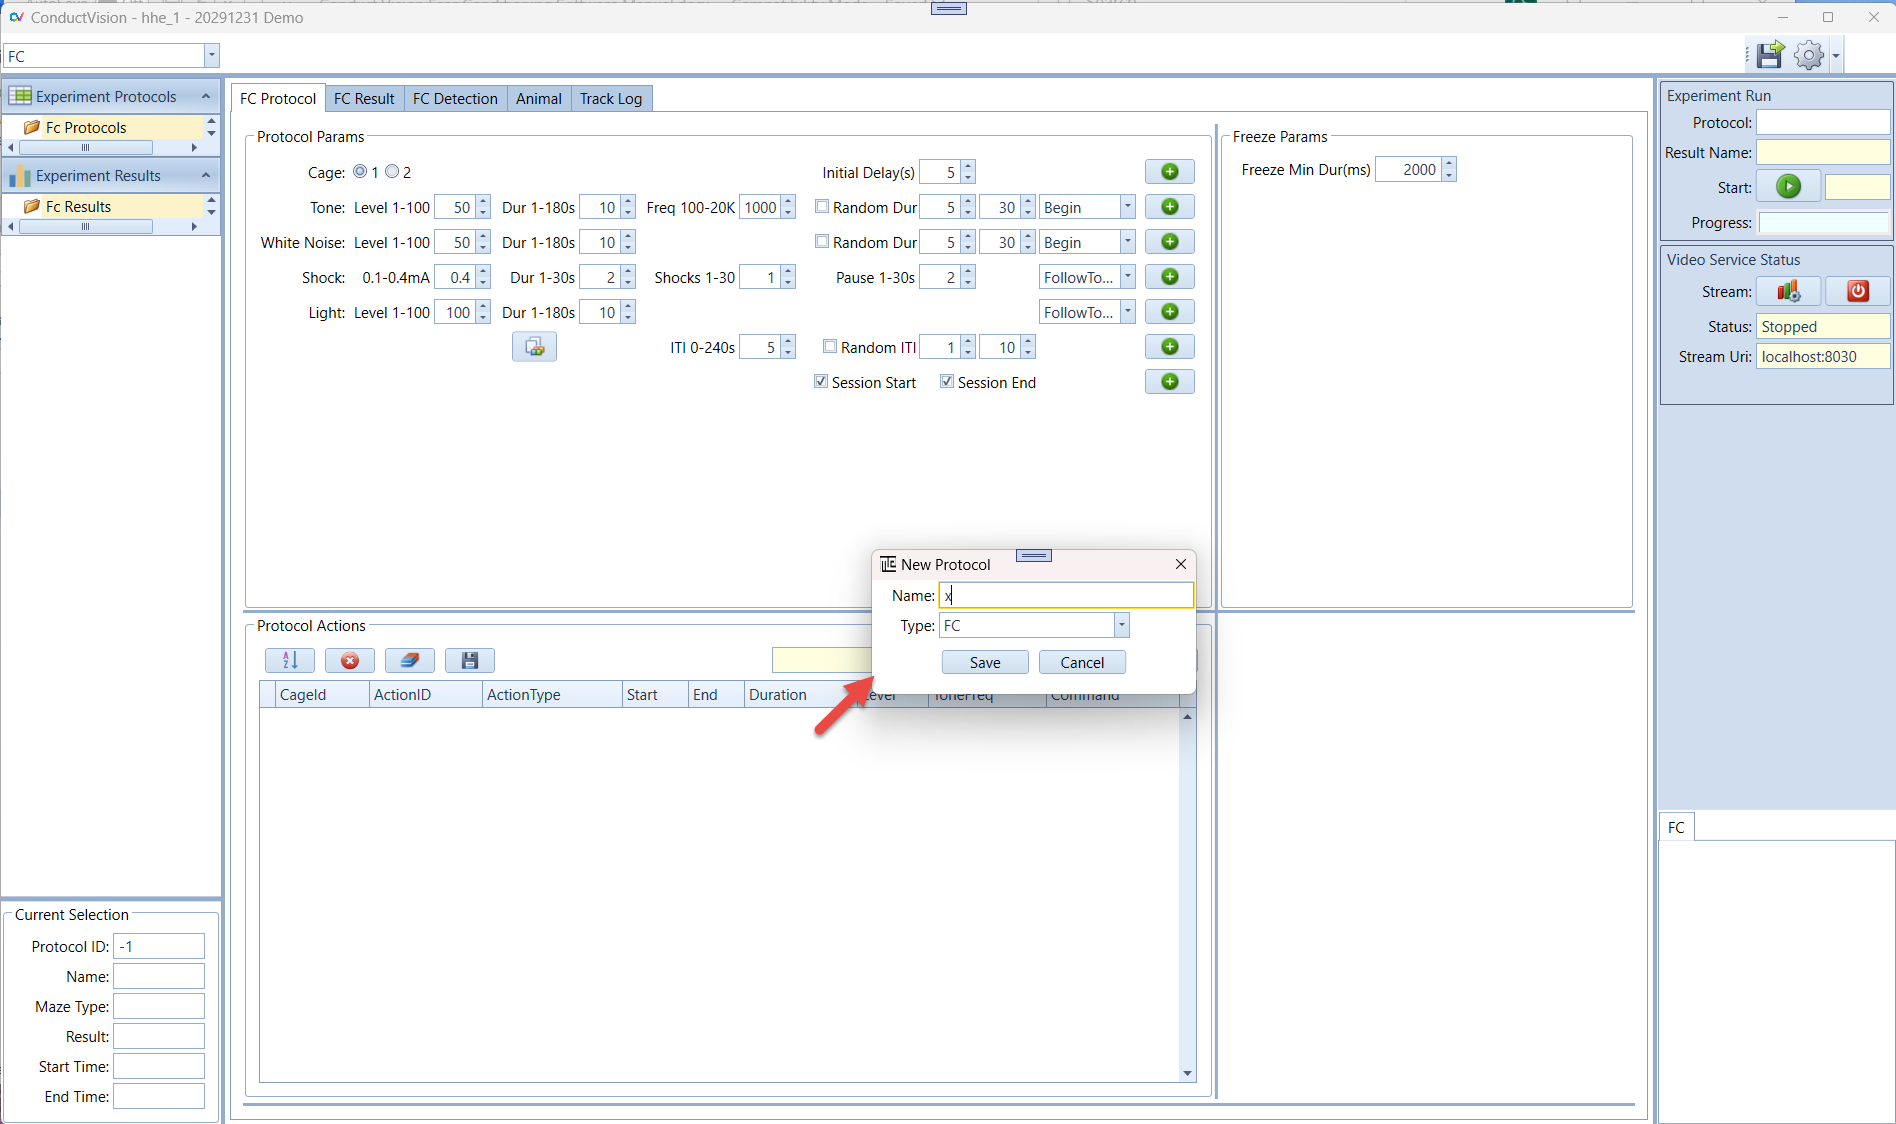
To create an experiment protocol:
- Click on "FC Protocols" on the left panel
- A menu item "New" appears as shown below
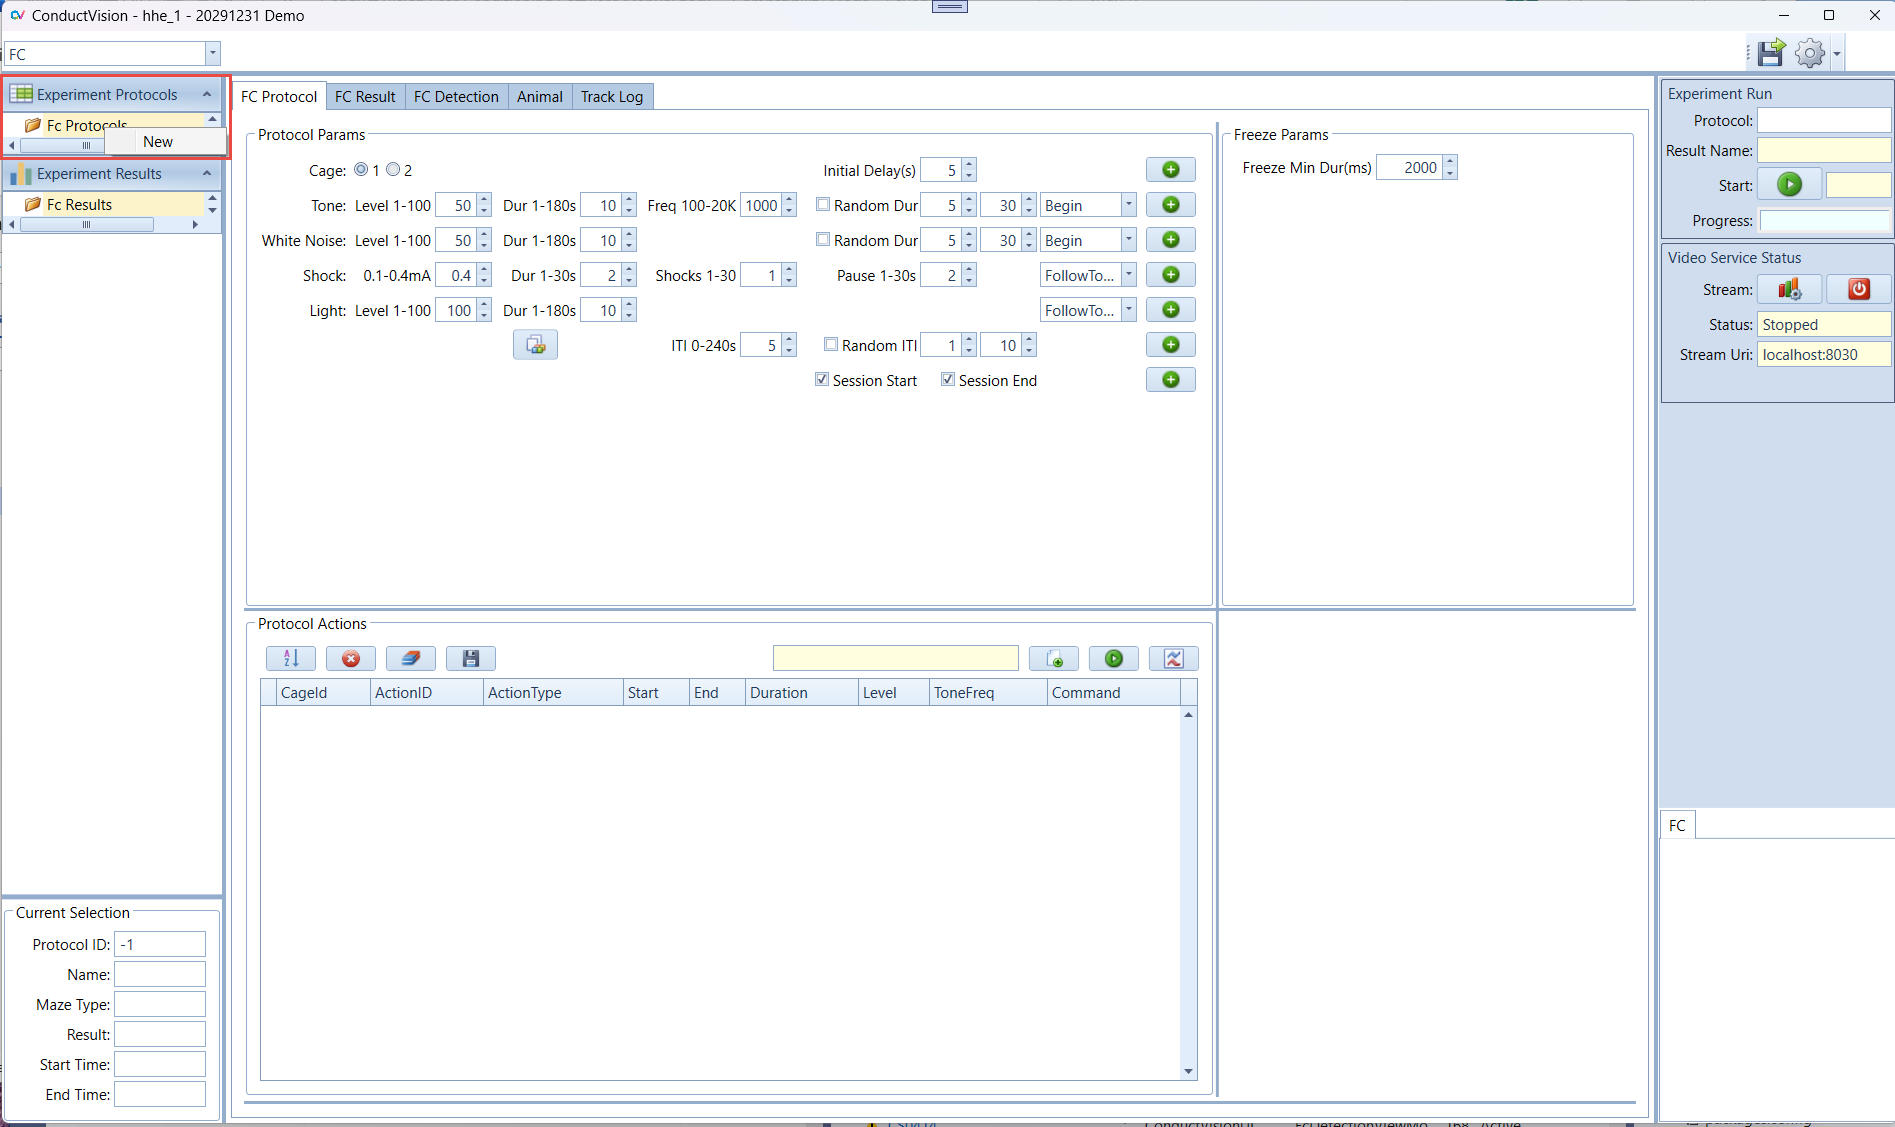
- Click on "New" menu item
- A "New Experiment" window appears
- Fill in an experiment name and click Save button
Once the protocol is created, it appears in the folder "FC Protocols":
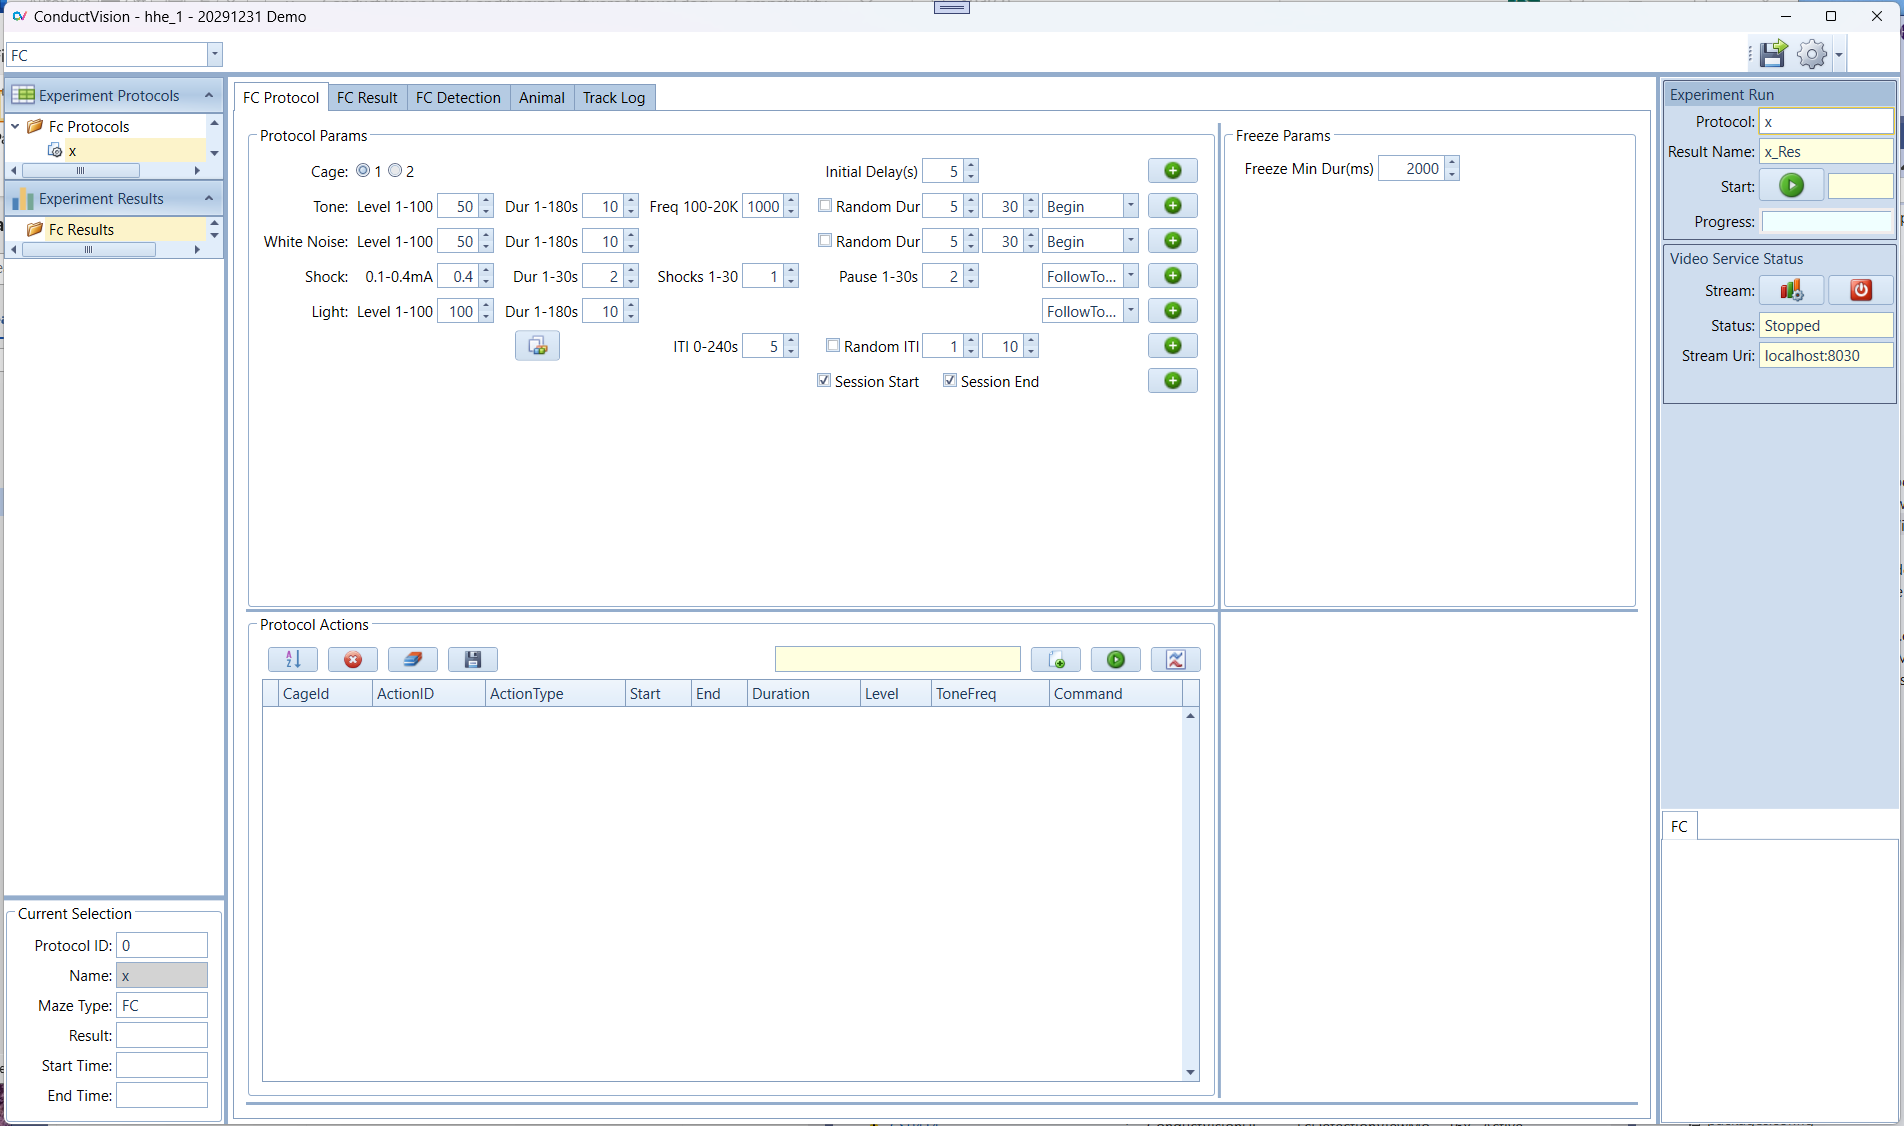
An experiment can be deleted by right-clicking on the experiment. The current active protocol is indicated in the left bottom of the screen.
3.2 Configure Stimulus Protocol
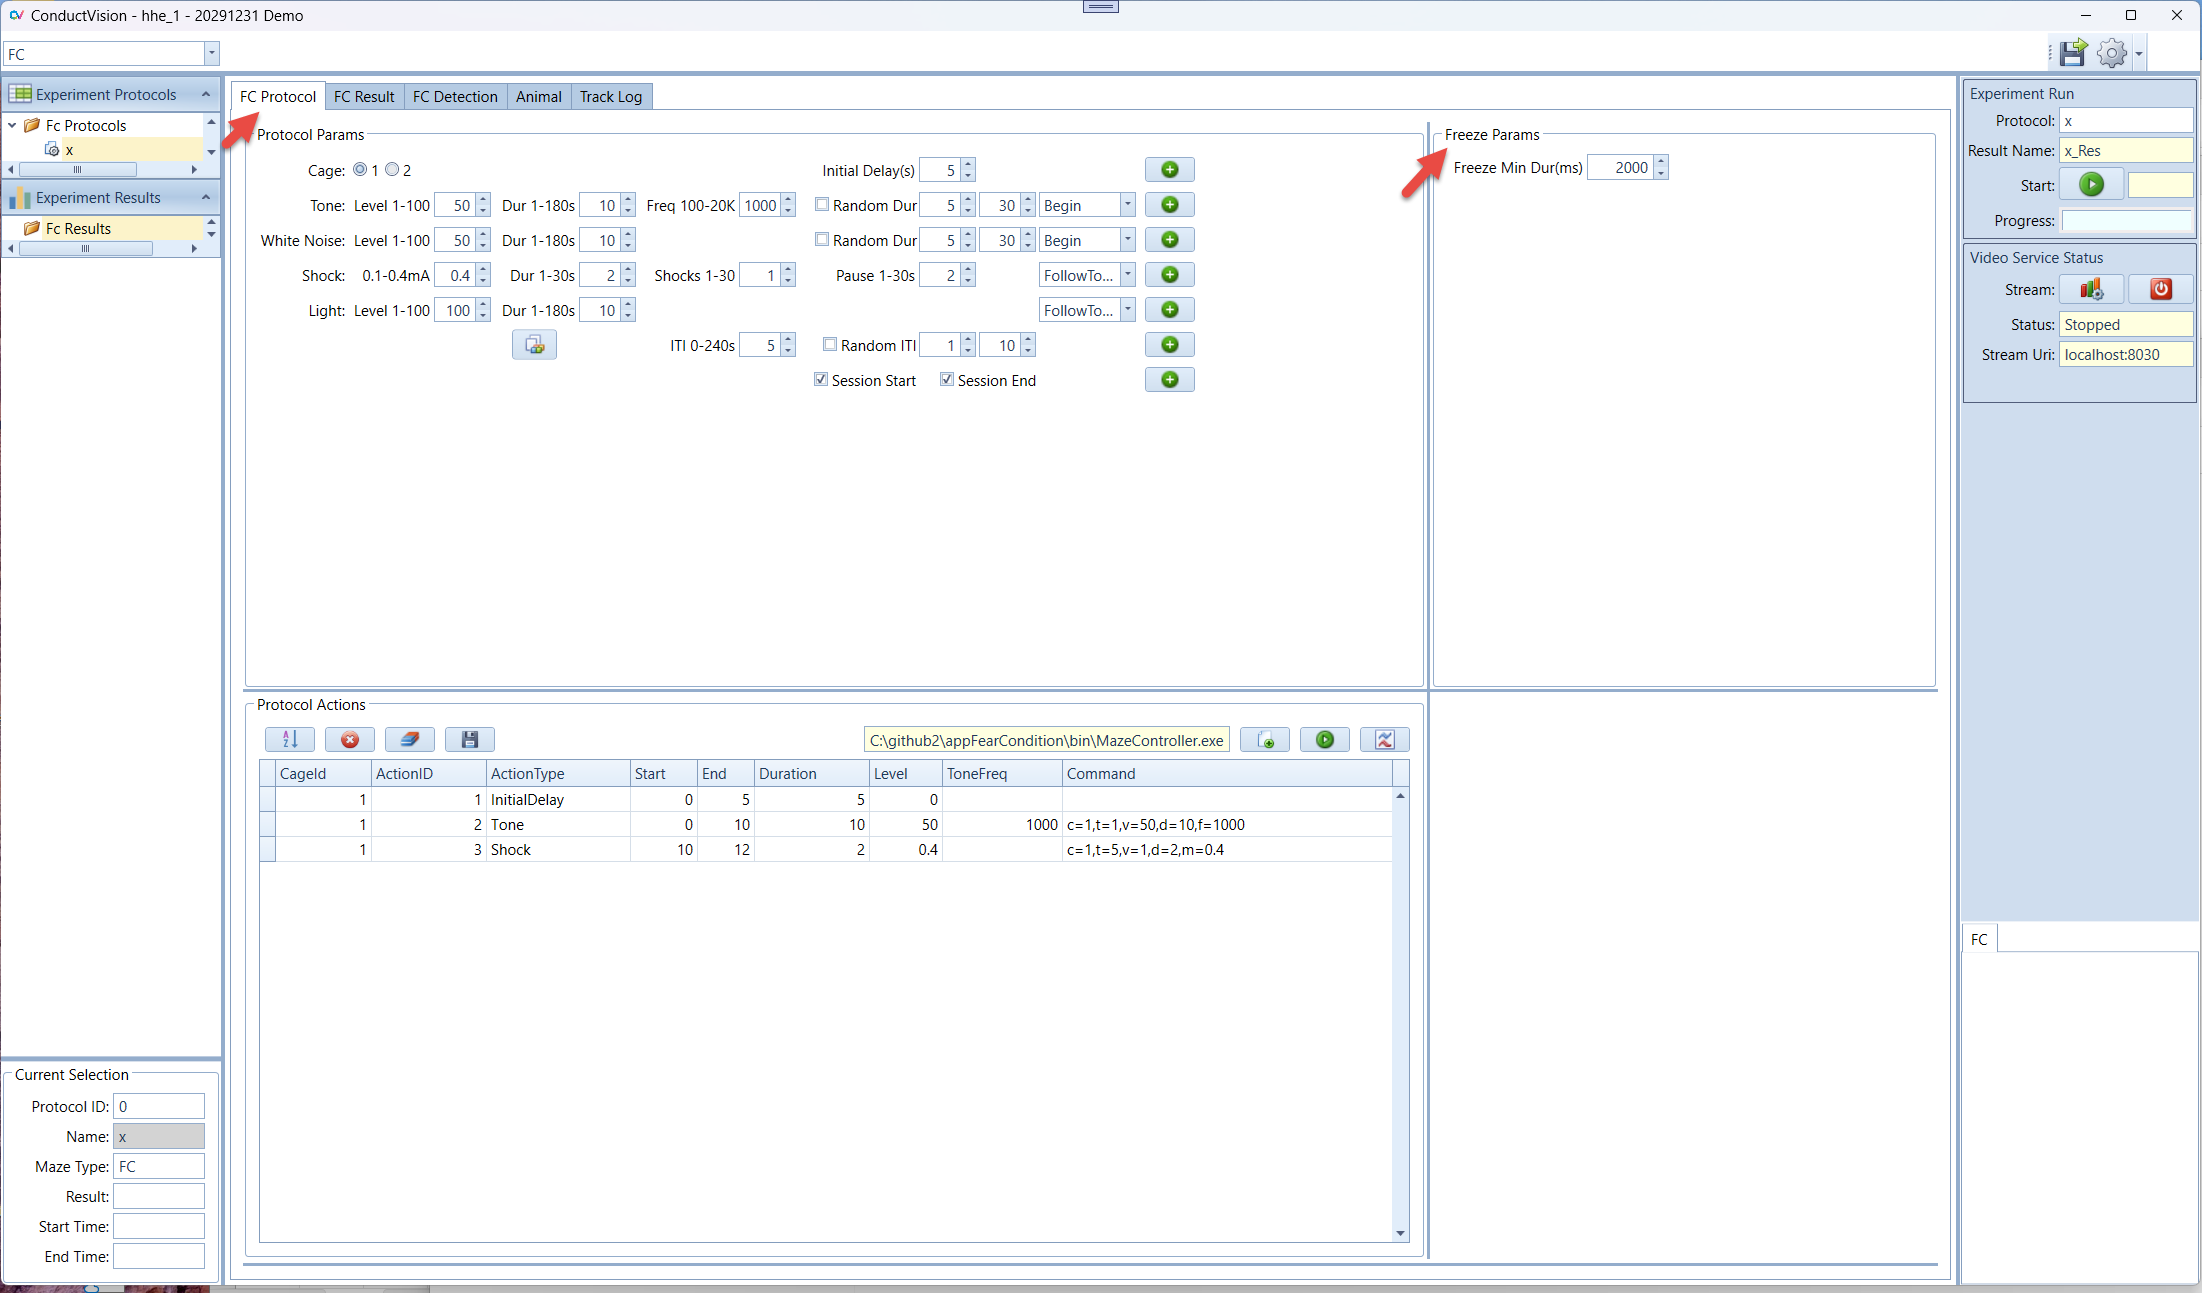
3.2.1 Protocol Stimulus Setup
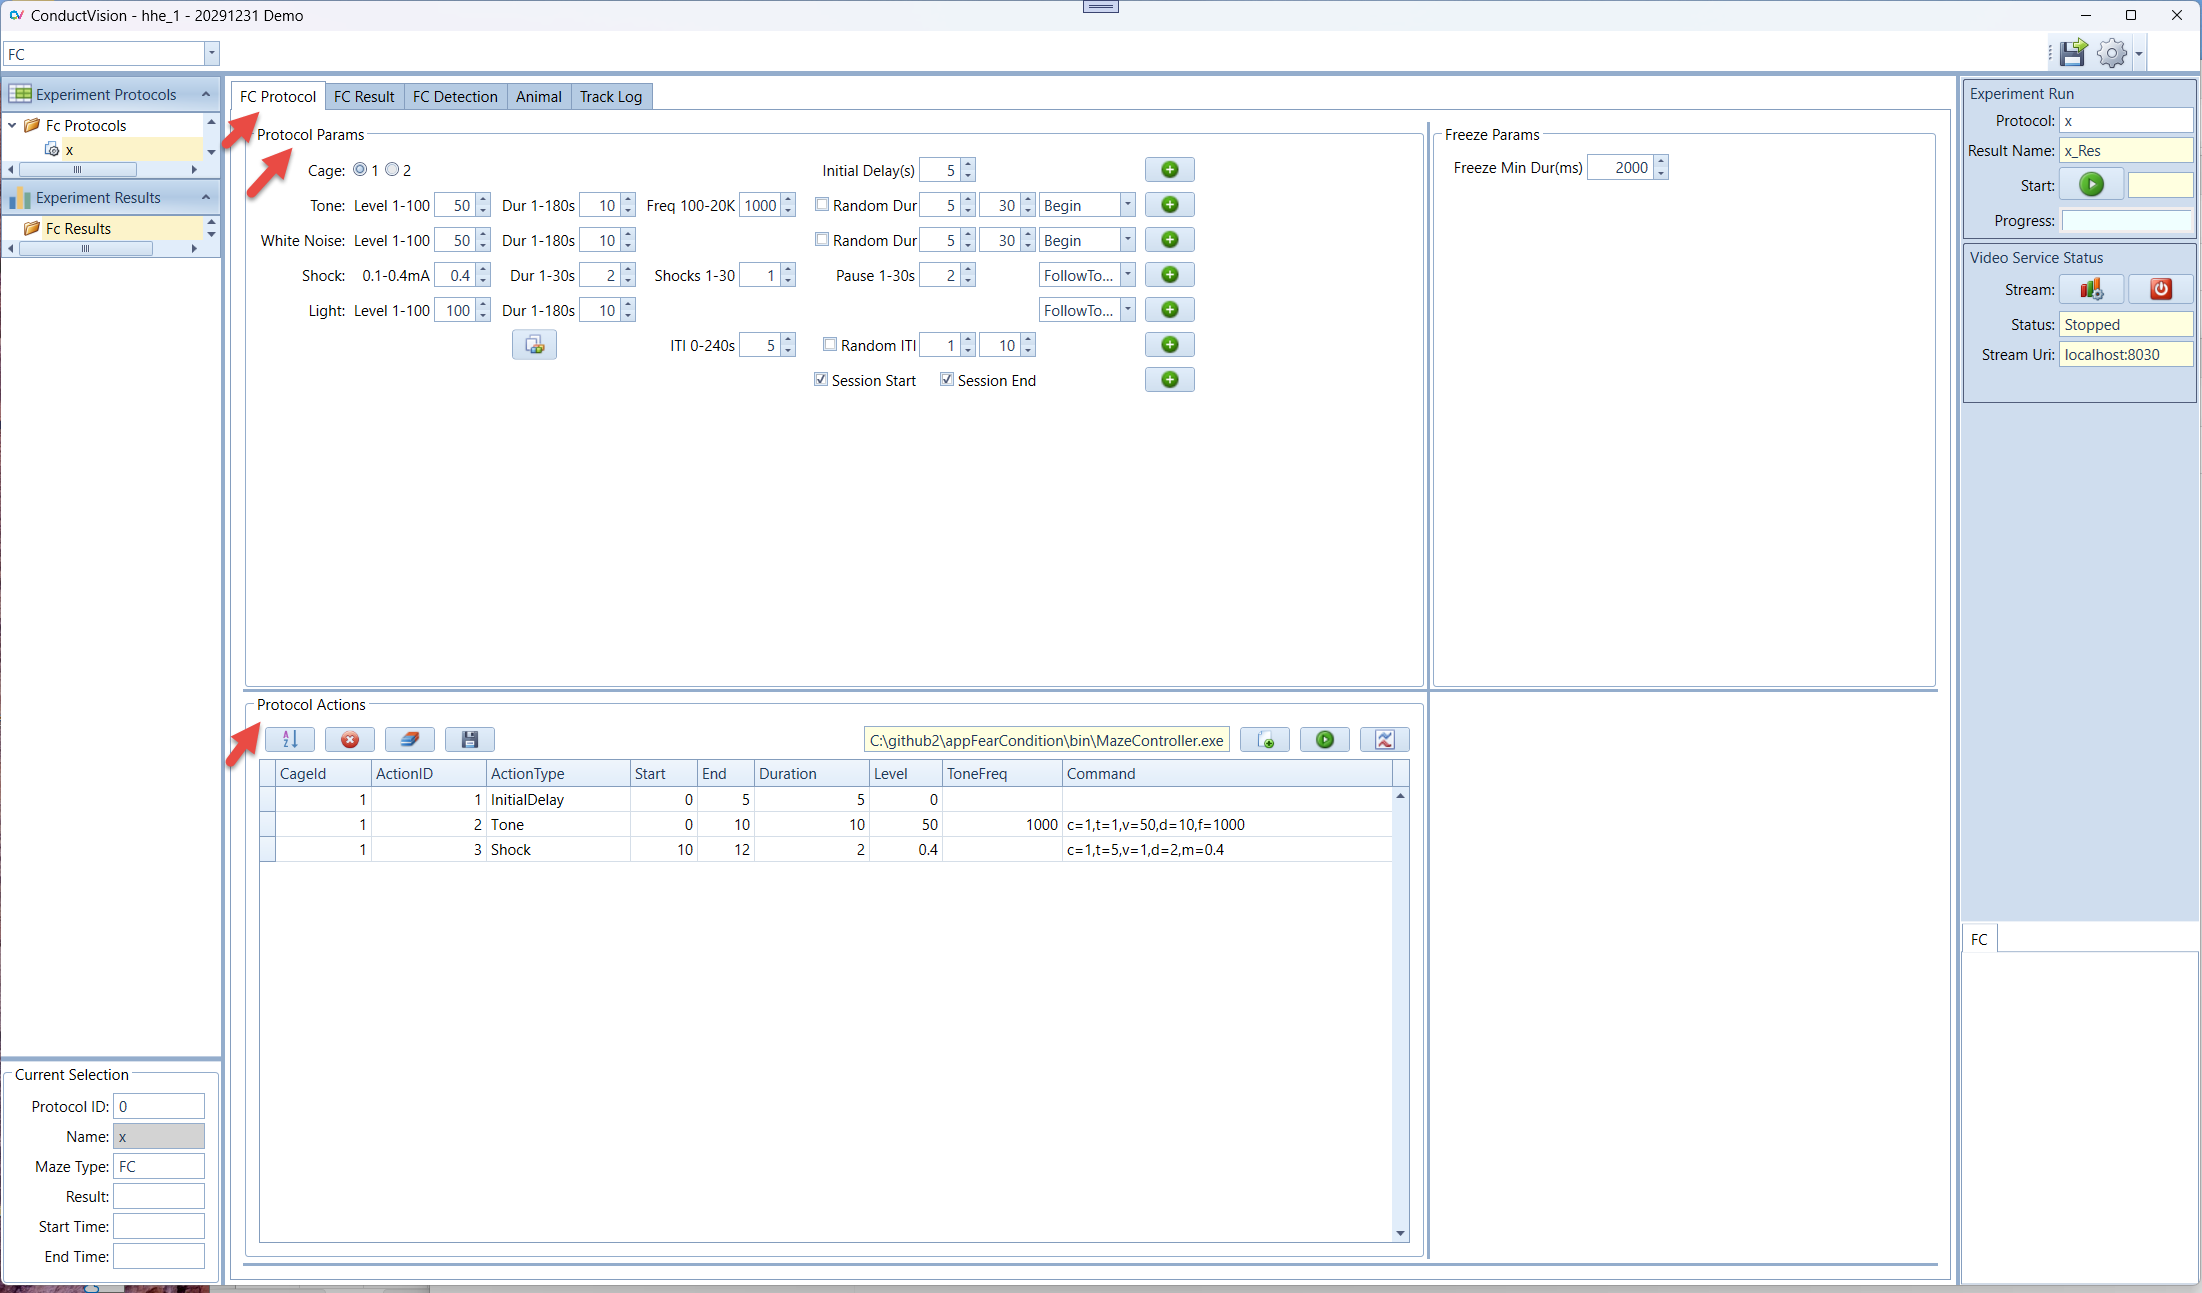
The tab panel "FC Parameter" contains the stimulus types (light, tone, white noise, shock) and allows the user to add each type to the Protocol Action table. The parameters contain the stimulus timing dependencies as well.
The number of cages is configurable. The system supports up to 4 cages simultaneously tracking and analysis.
- Copy protocol stimulus setup for one cage to another cage
- Protocol Action grid - View, edit, and test Protocol Actions
MazeController Setup:
- Load the MazeController from the ConductAdapterUI bin folder
- The executable is used to send commands to ConductAdapterUI to control the hardware
- The text field displays the executable file path
Testing:
- Send commands to ConductAdapterUI for manual testing
- Visualize the stimulus actions in the FC Detection tab
3.2.2 Test Commands
Before running the full tracking, it is helpful to run the commands to ensure communication between ConductVision and ConductAdapterUI is properly established.
See ConductAdapter chapter for more details on the ConductAdapterUI side.
3.3 Configure Video Tracking
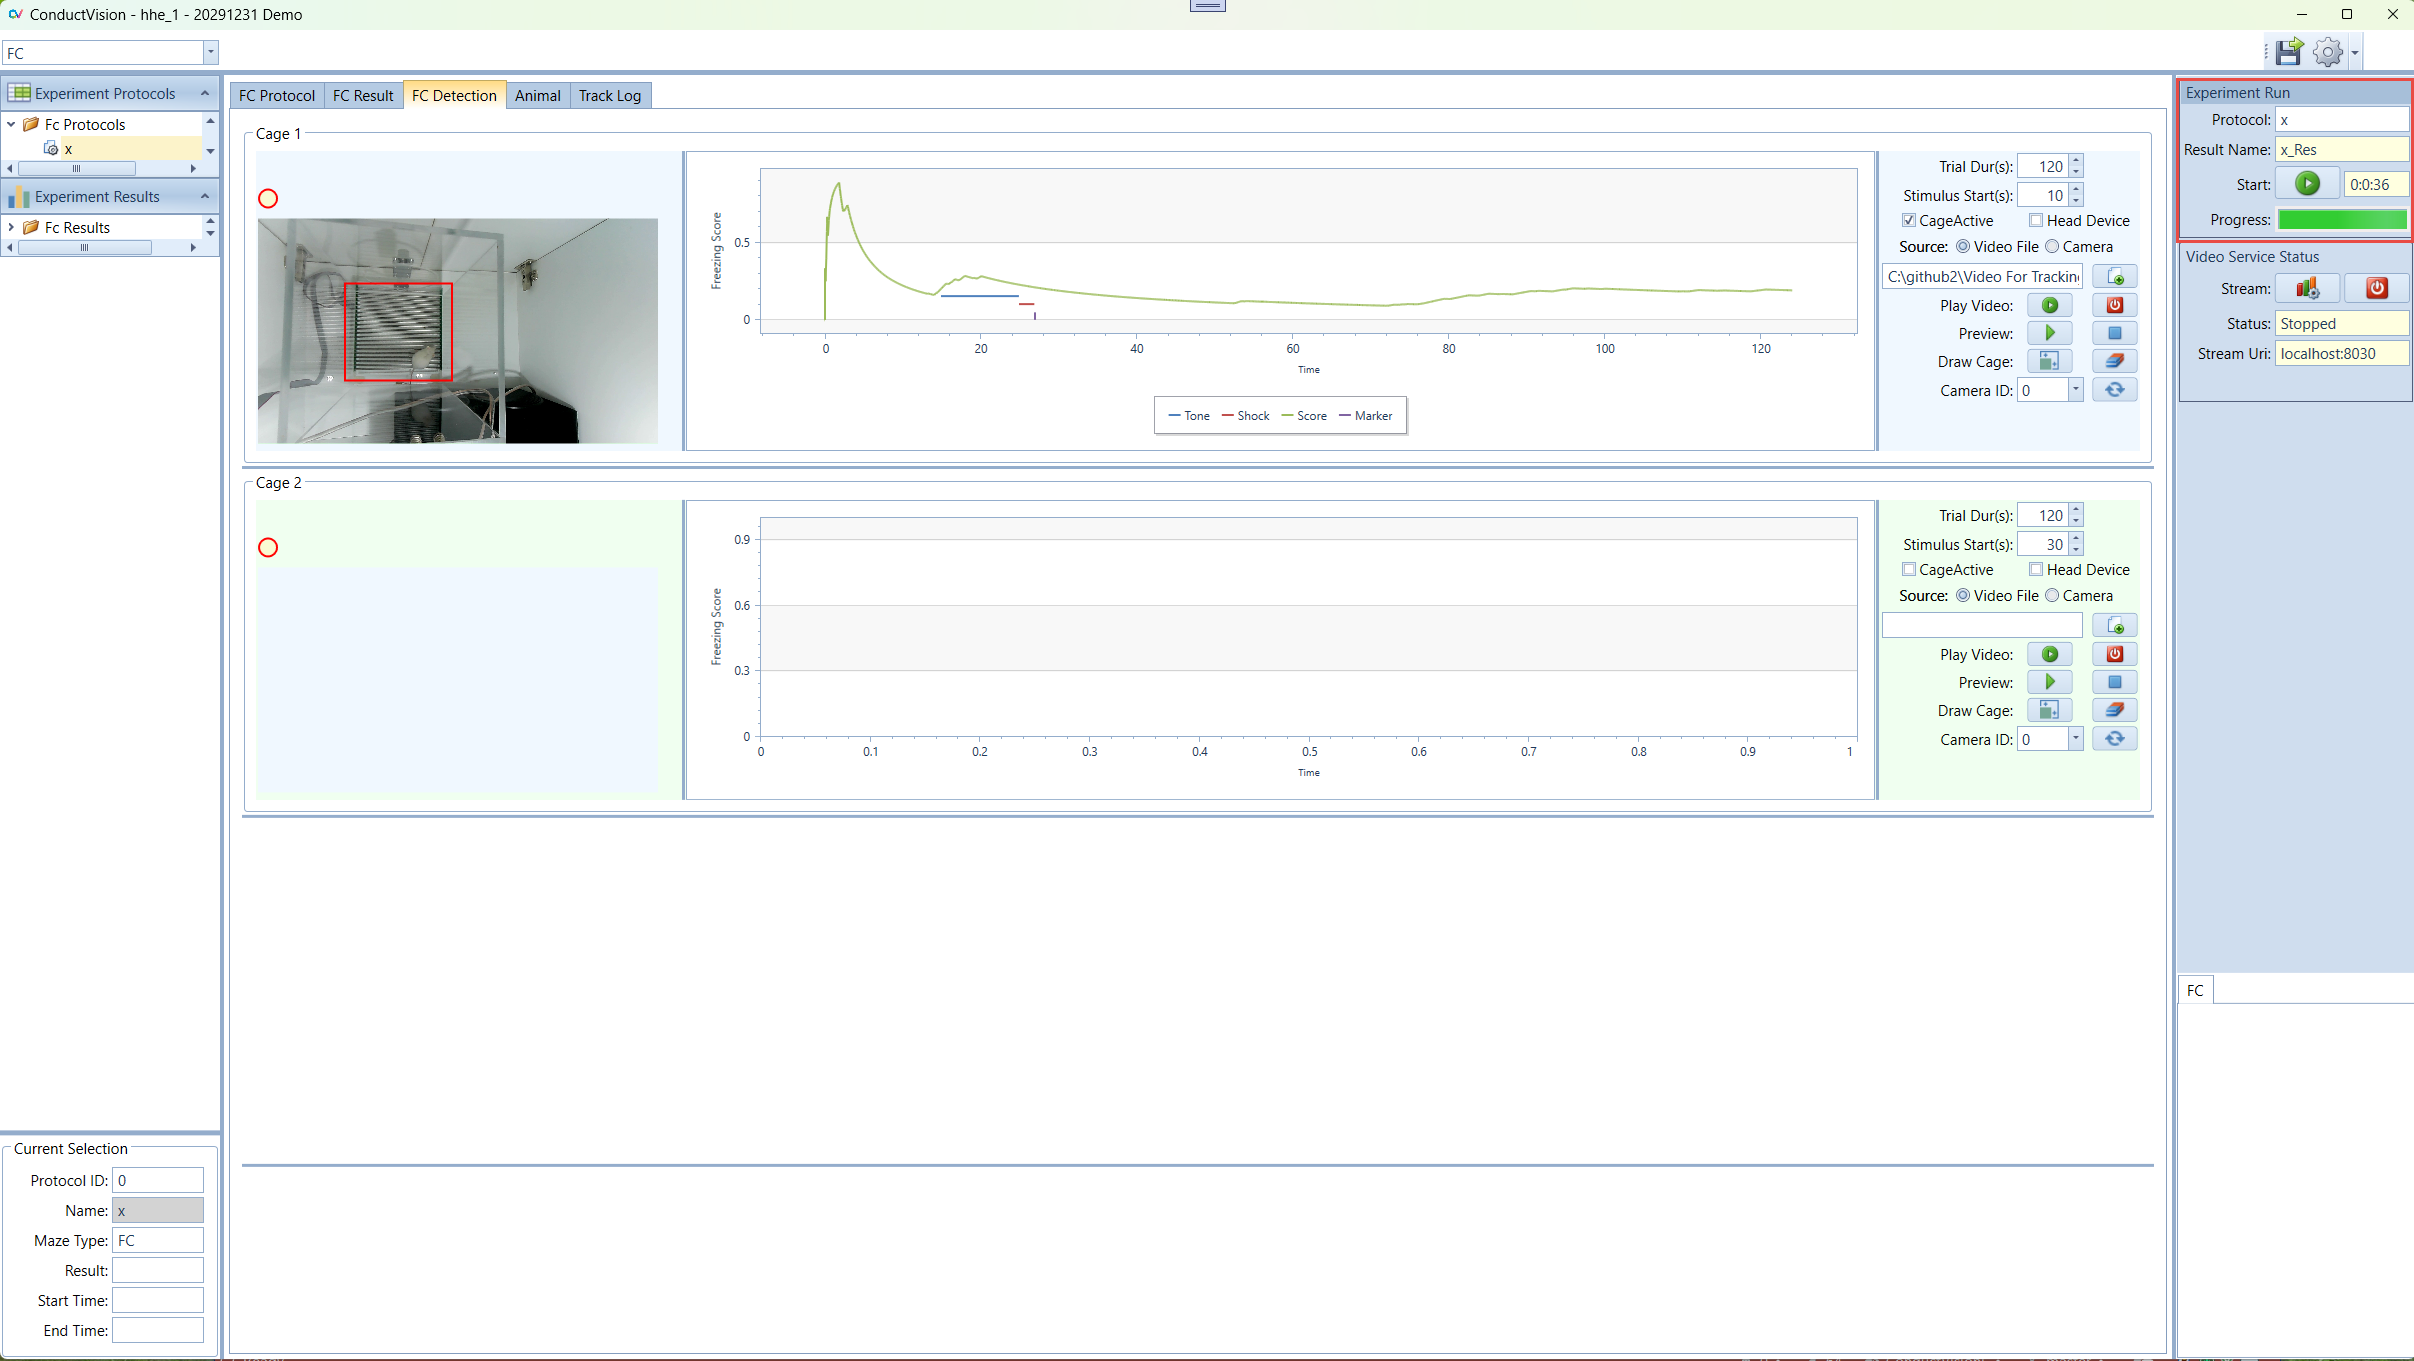
To configure video tracking parameters, double click on the experiment under the folder "FC Protocols" and go to the FC Detection tab.
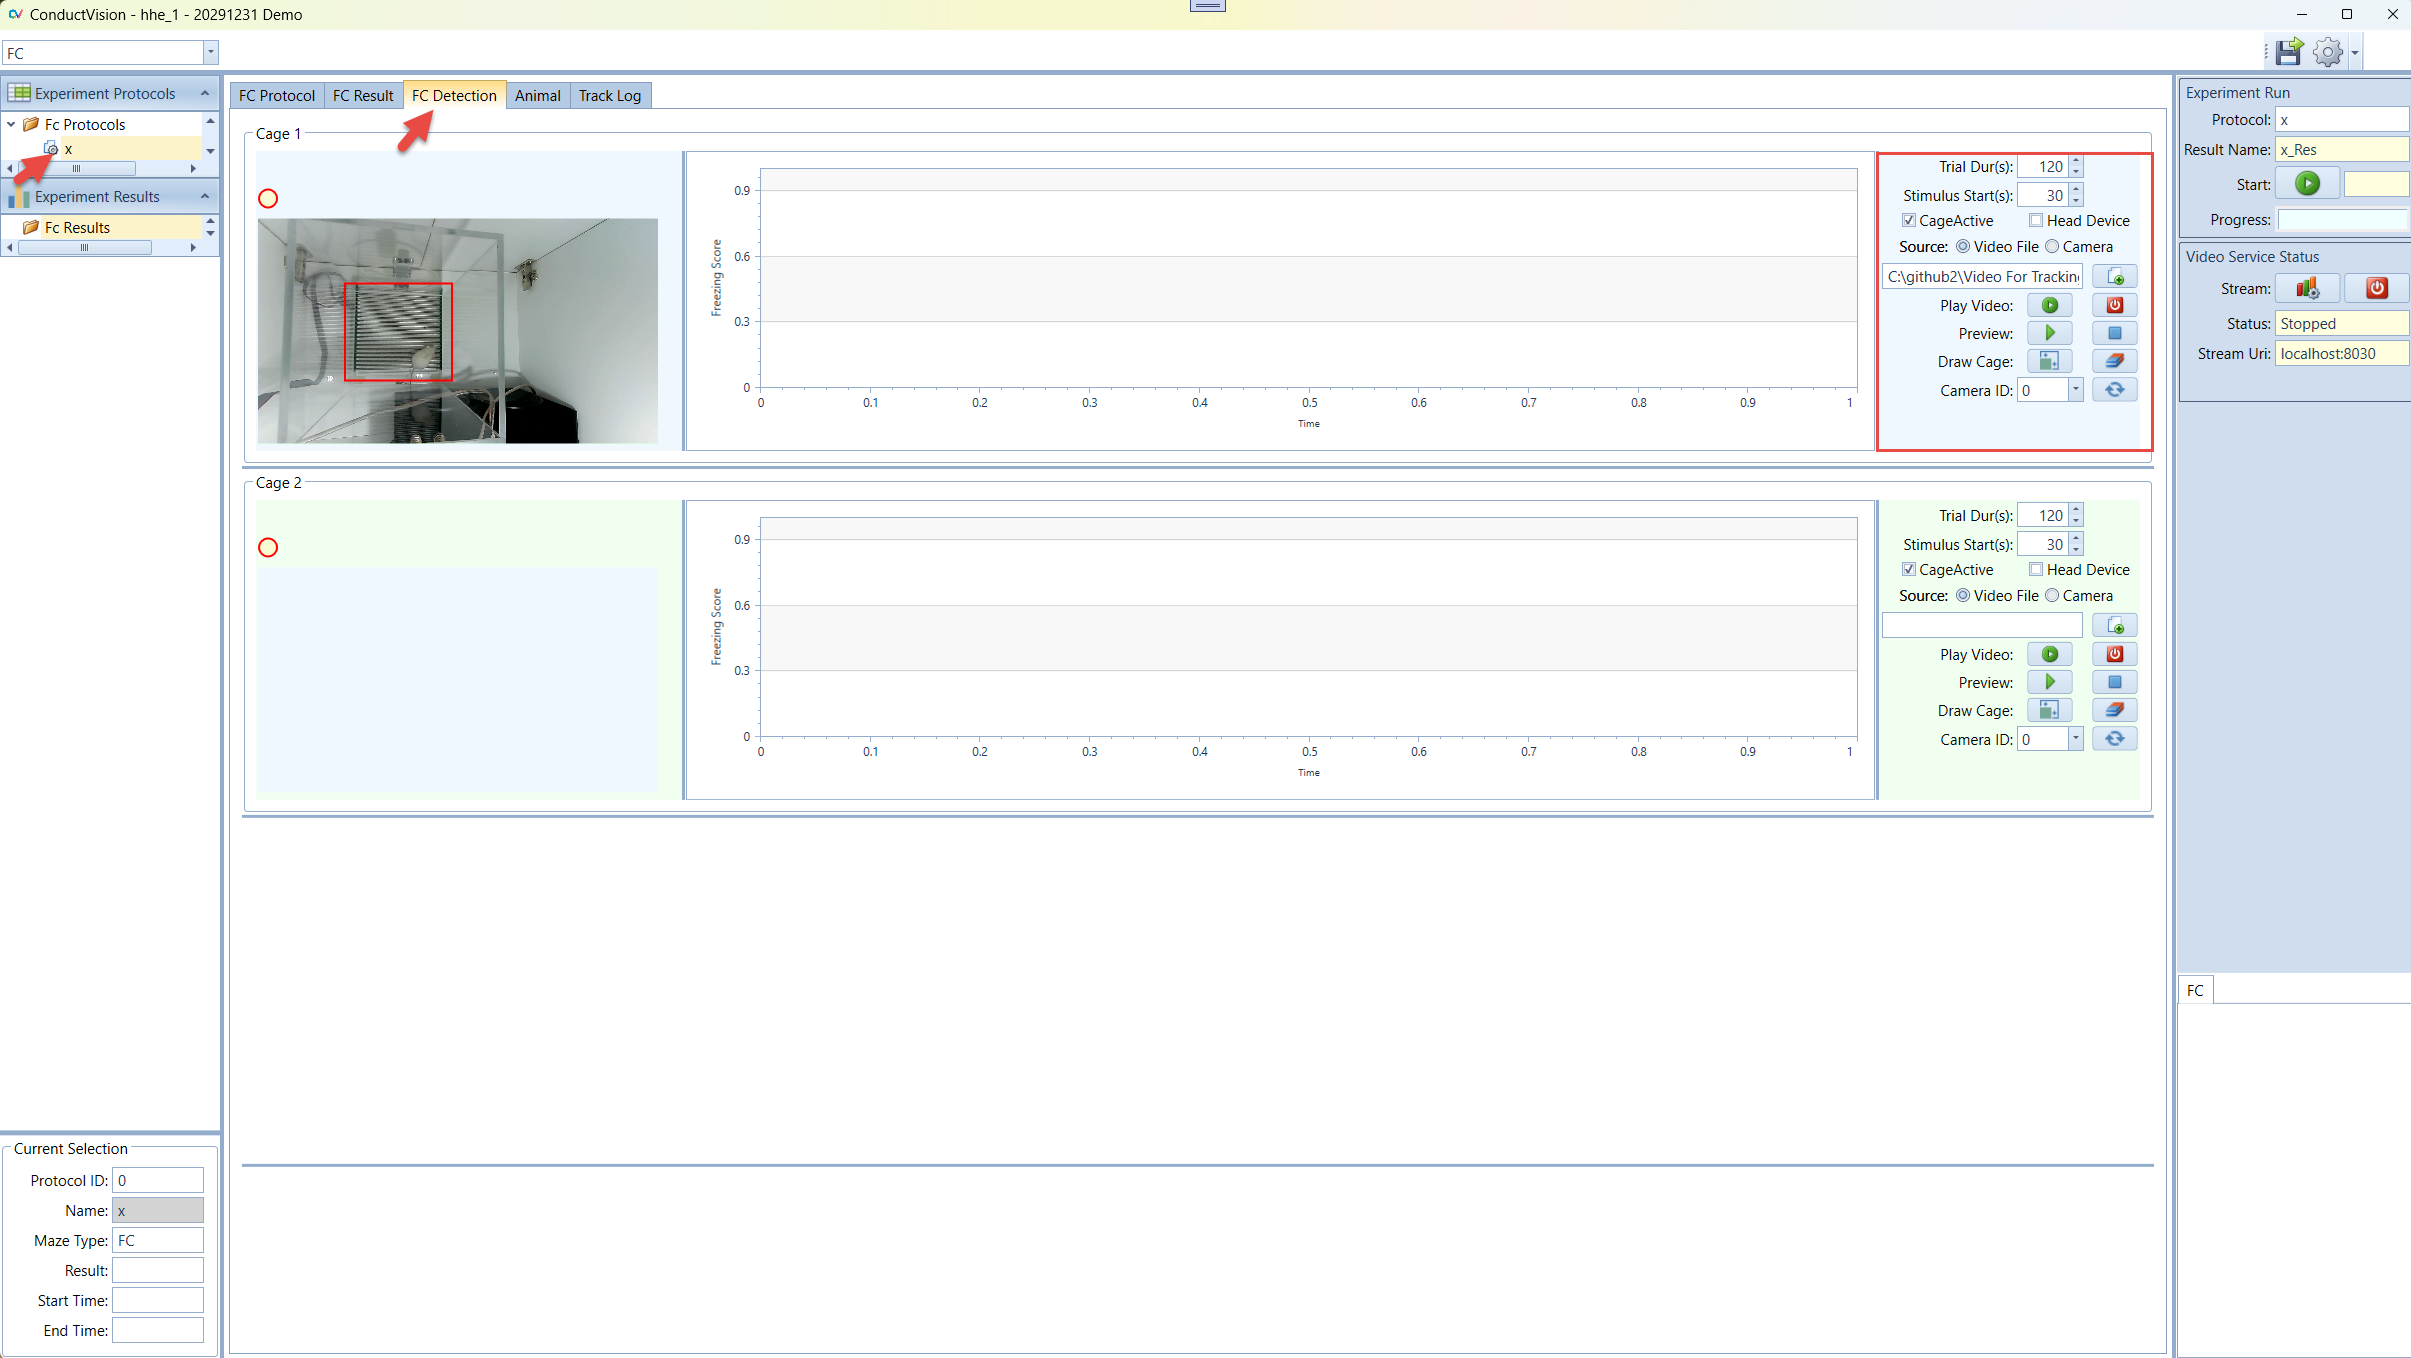
3.3.1 Tracking Parameters
- Trial Durs(s) - Total video tracking duration in seconds
- Stimulus Start(s) - Stimulus start time with a delay from the video tracking start
- Cage Active - Indicates if this cage is active in the tracking when there are multiple cages. If unchecked, the cage will not participate in tracking
- Head Device - Indicates if the animal has an optogenetic device mounted on the head with wires. If there is no head device, a motion pixel change algorithm is used; otherwise, an AI-based pose estimation model is used to detect animal motion that filters out wire movements
- Source - Indicates if the video source is from a video file or real-time camera tracking
- Video File - To track a video file, the user needs to load a video file
- Camera - For real-time rodent tracking
- Video File Path - If the video source is file, the video file needs to be loaded
- Preview - In live tracking mode, the user can preview the maze. Stop preview will produce a thumbnail that can be used for drawing the tracking areas
- Draw Cage - Draw cage bound rectangle as a tracking area
- Camera ID - In case of multiple cages, camera ID needs to be assigned to each cage properly. Connect one camera to the computer, assign the camera ID to the cage. Then connect additional cameras sequentially and assign each camera ID to the corresponding cage. For example, if you have four cages, continue this process to assign the four cameras to four cages so that each cage has a unique camera ID.
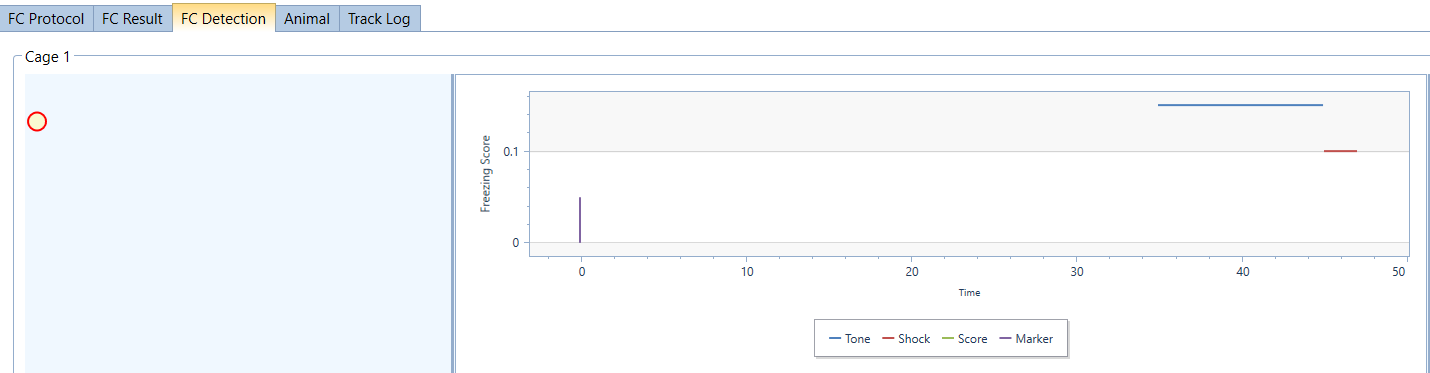
3.3.2 Freeze Score and Stimulus Visualization
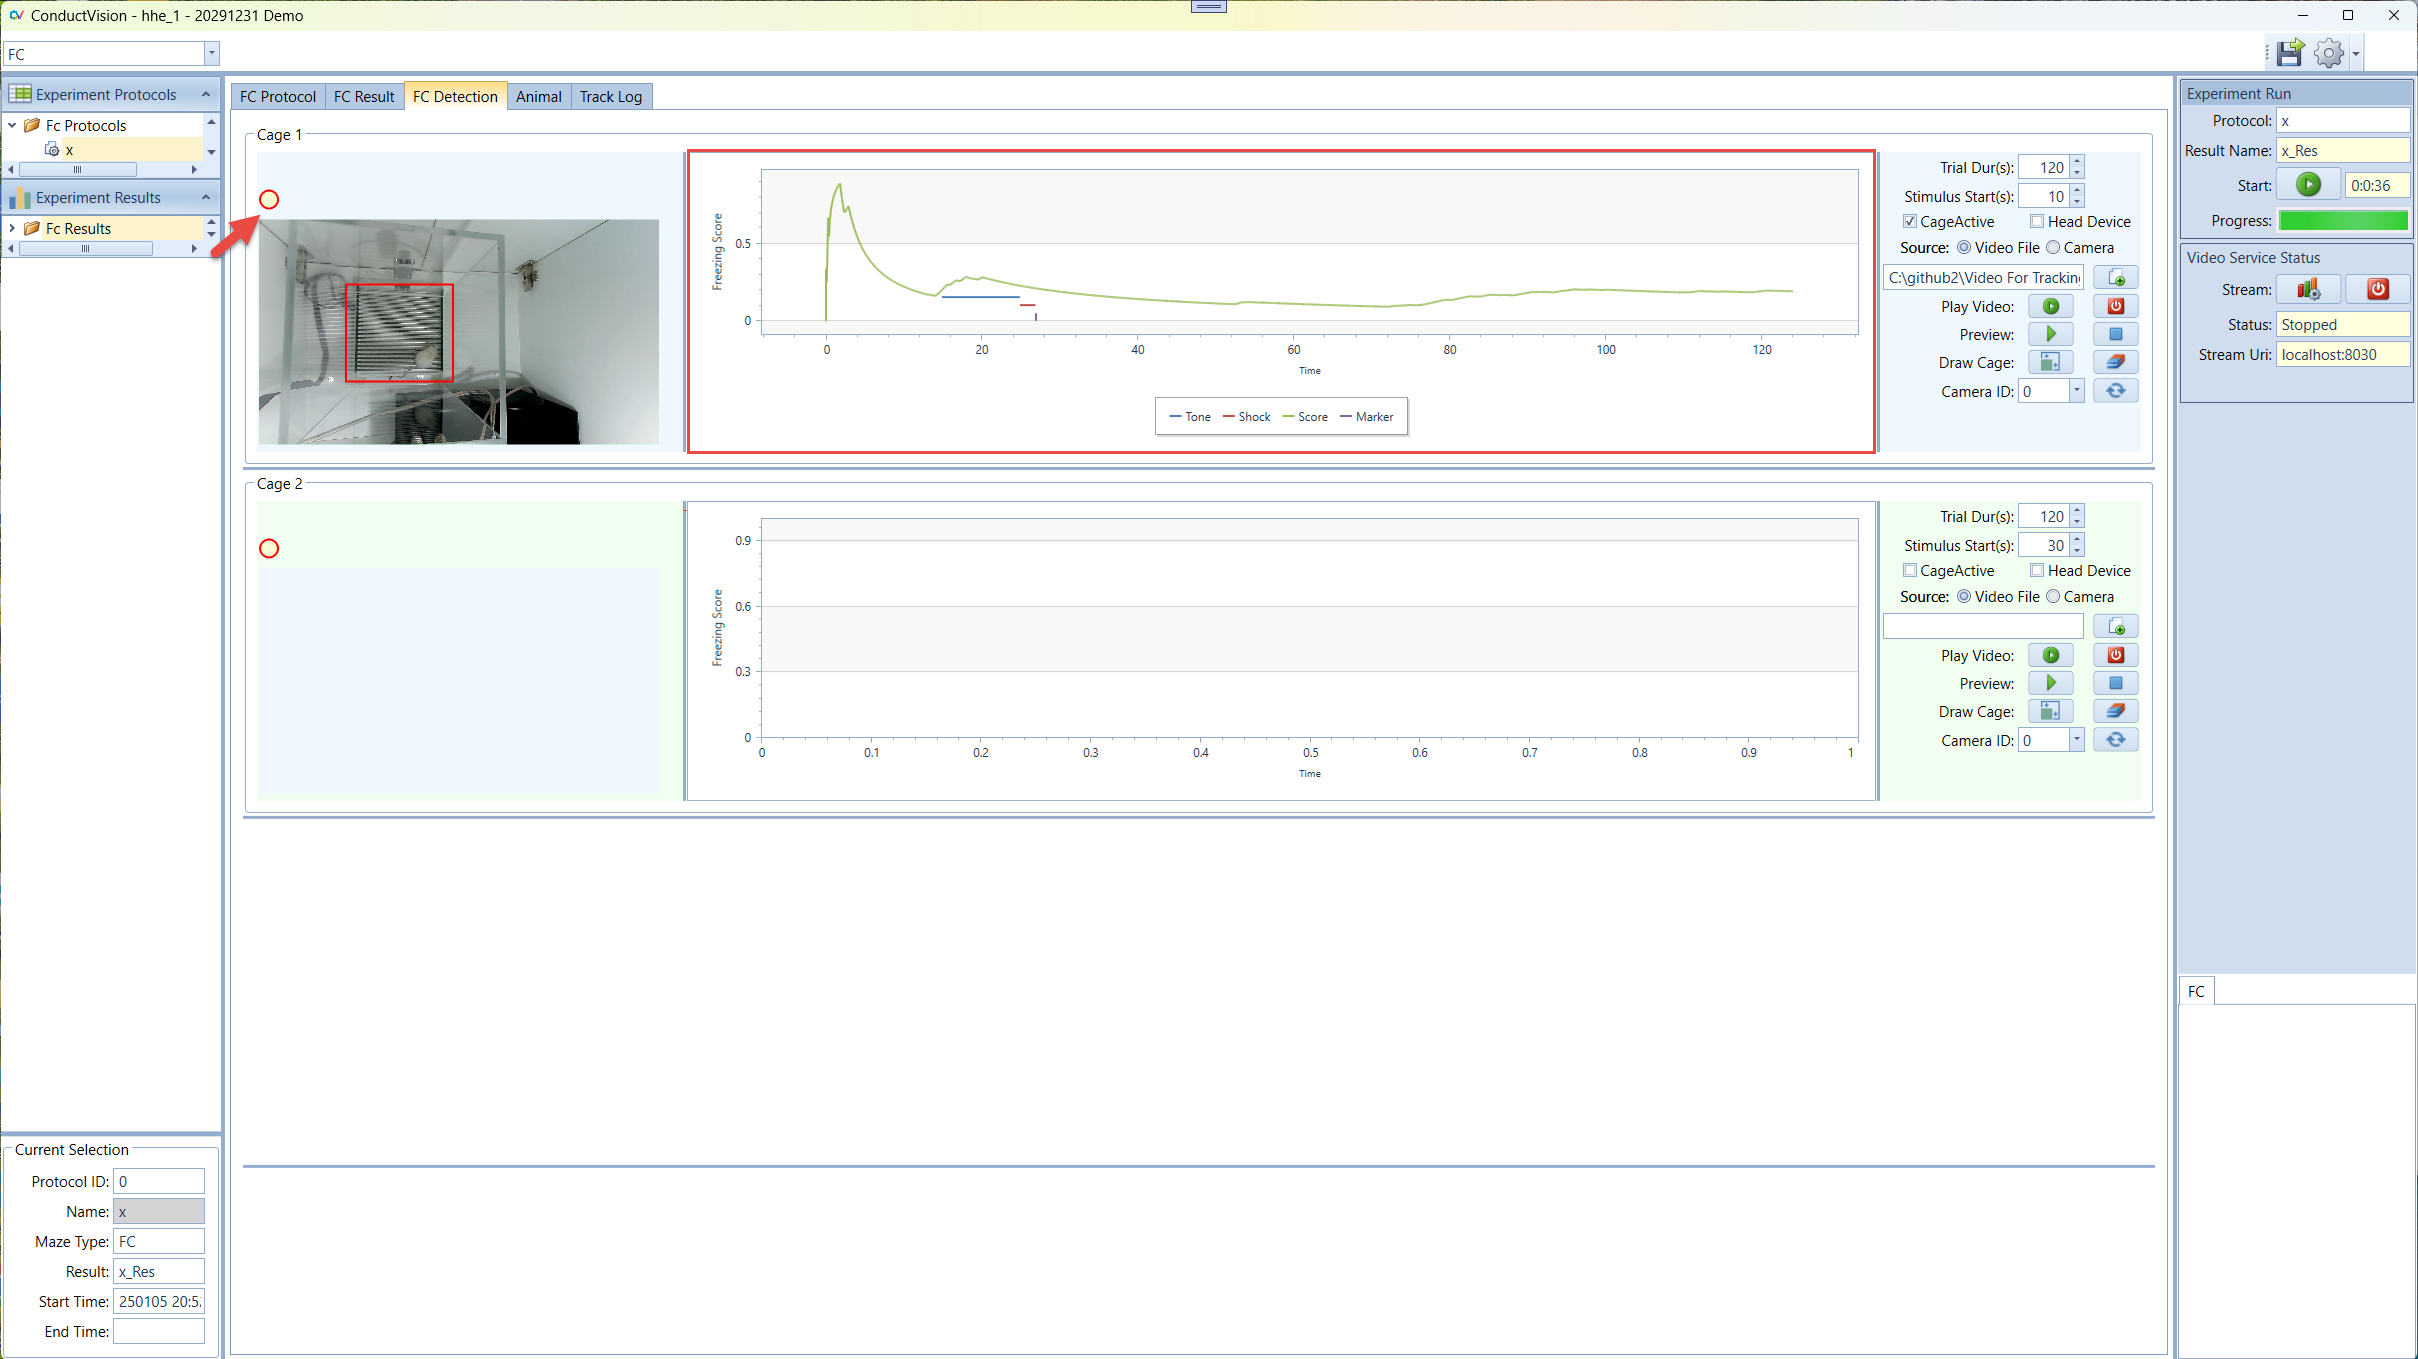
Chart Elements:
- Freeze Score (green line) - Cumulative freeze frames / total frames
- Stimulus (blue and red line) - When the stimuli occur
- Marker (purple line) - Moves every second along with stimuli
- Freeze Circle - Turns yellow when the current frame is a freeze frame and turns off when the frame is not a freeze frame. Turns red when the freezing frames become a freezing episode (the consecutive freeze frame duration exceeds the freezing criteria)
3.3.3 Freezing Episode
A freezing episode occurs if the animal is motionless for a duration equal to or greater than the parameter "Freeze Min Duration in Milliseconds."
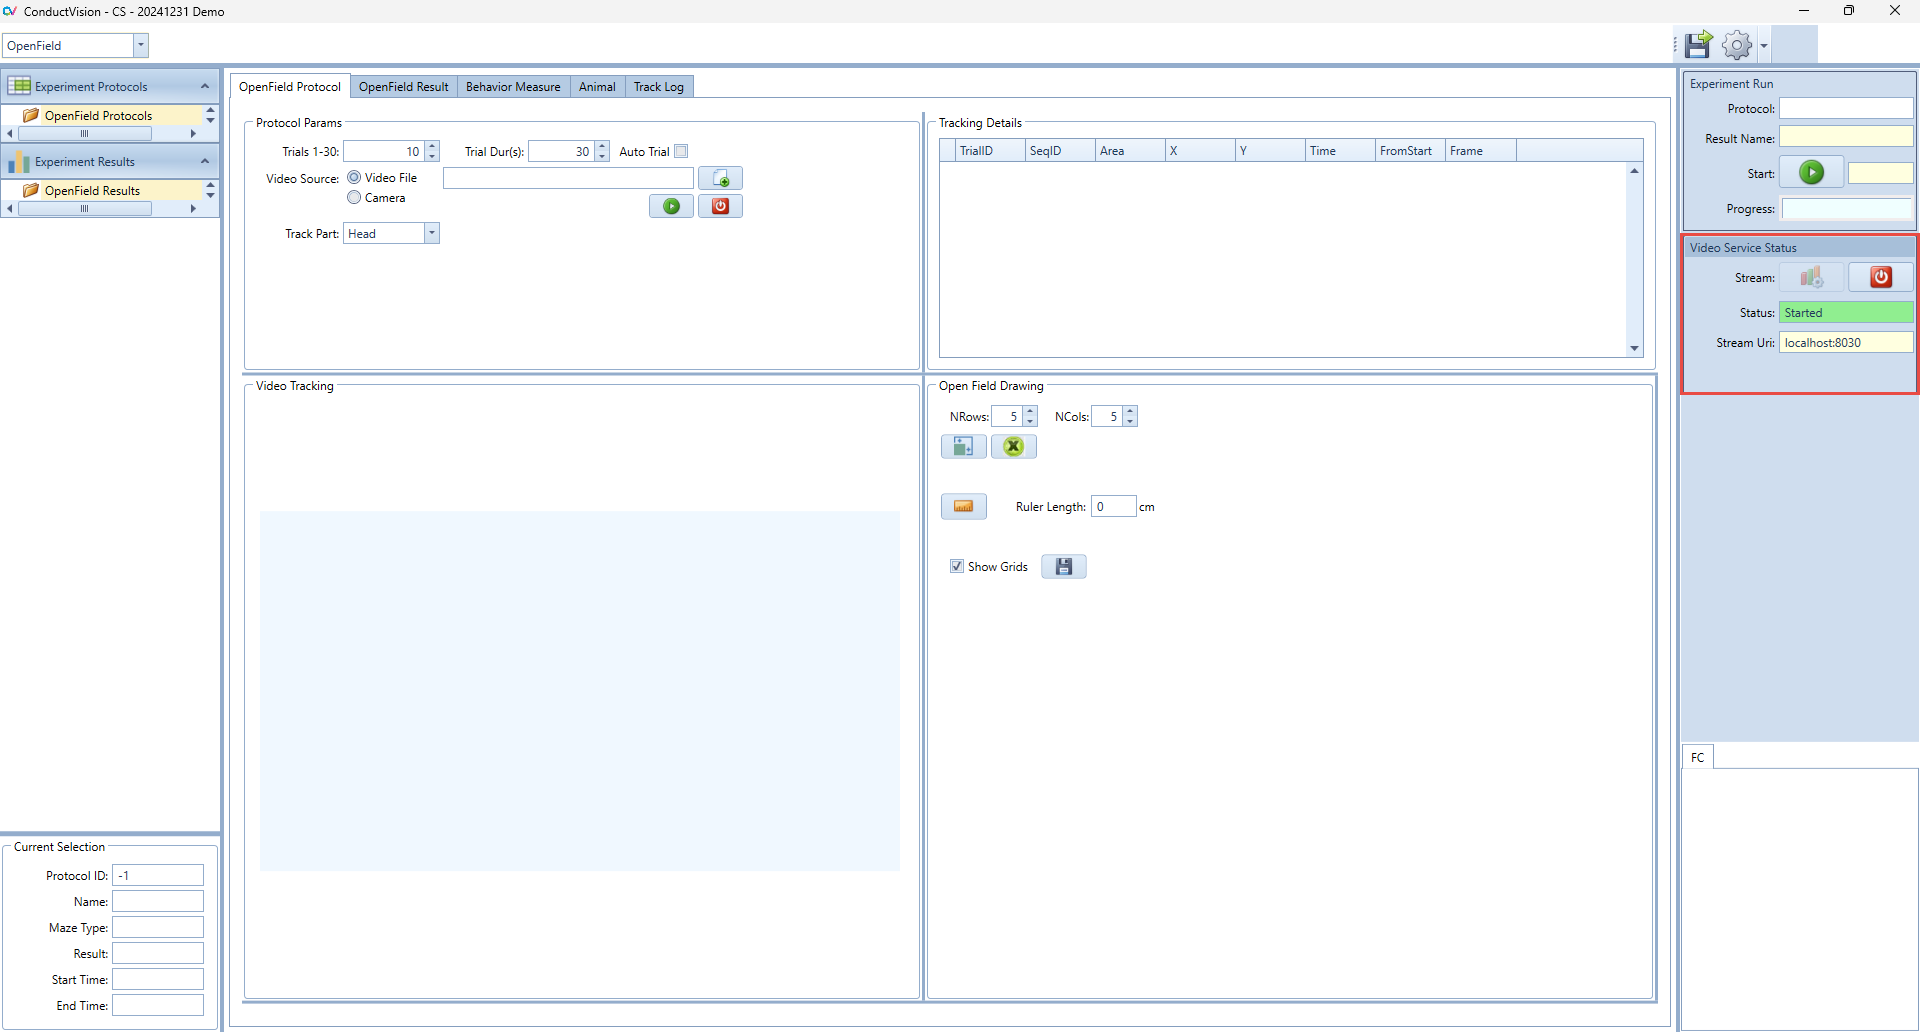
4. Video Service Connection
To use AI-based video tracking service, the user needs to start the service stream. When the service stream is established, the status field shows text "Started" and the color becomes green. If there is a need to stop the stream because of an exception, click on the stop button and then start again.
When the application starts, it is in the stop state.
The stream uses local machine port. It is usually available for users. If the port is blocked, please contact your system administrator to open the port.
5. Experiment Run
To execute an experiment, select the protocol under "Protocols" on the left navigation panel and double click on it. Make sure the service stream is connected.
5.1 Run Experiment
Enter a name for the experiment run and click Start button. This will set system in the running state.
When the start button is clicked, the state button becomes Stop. The user can click on the Stop button to stop the session run.
The experiment will stop when the total trial duration is reached, or the user stops it.
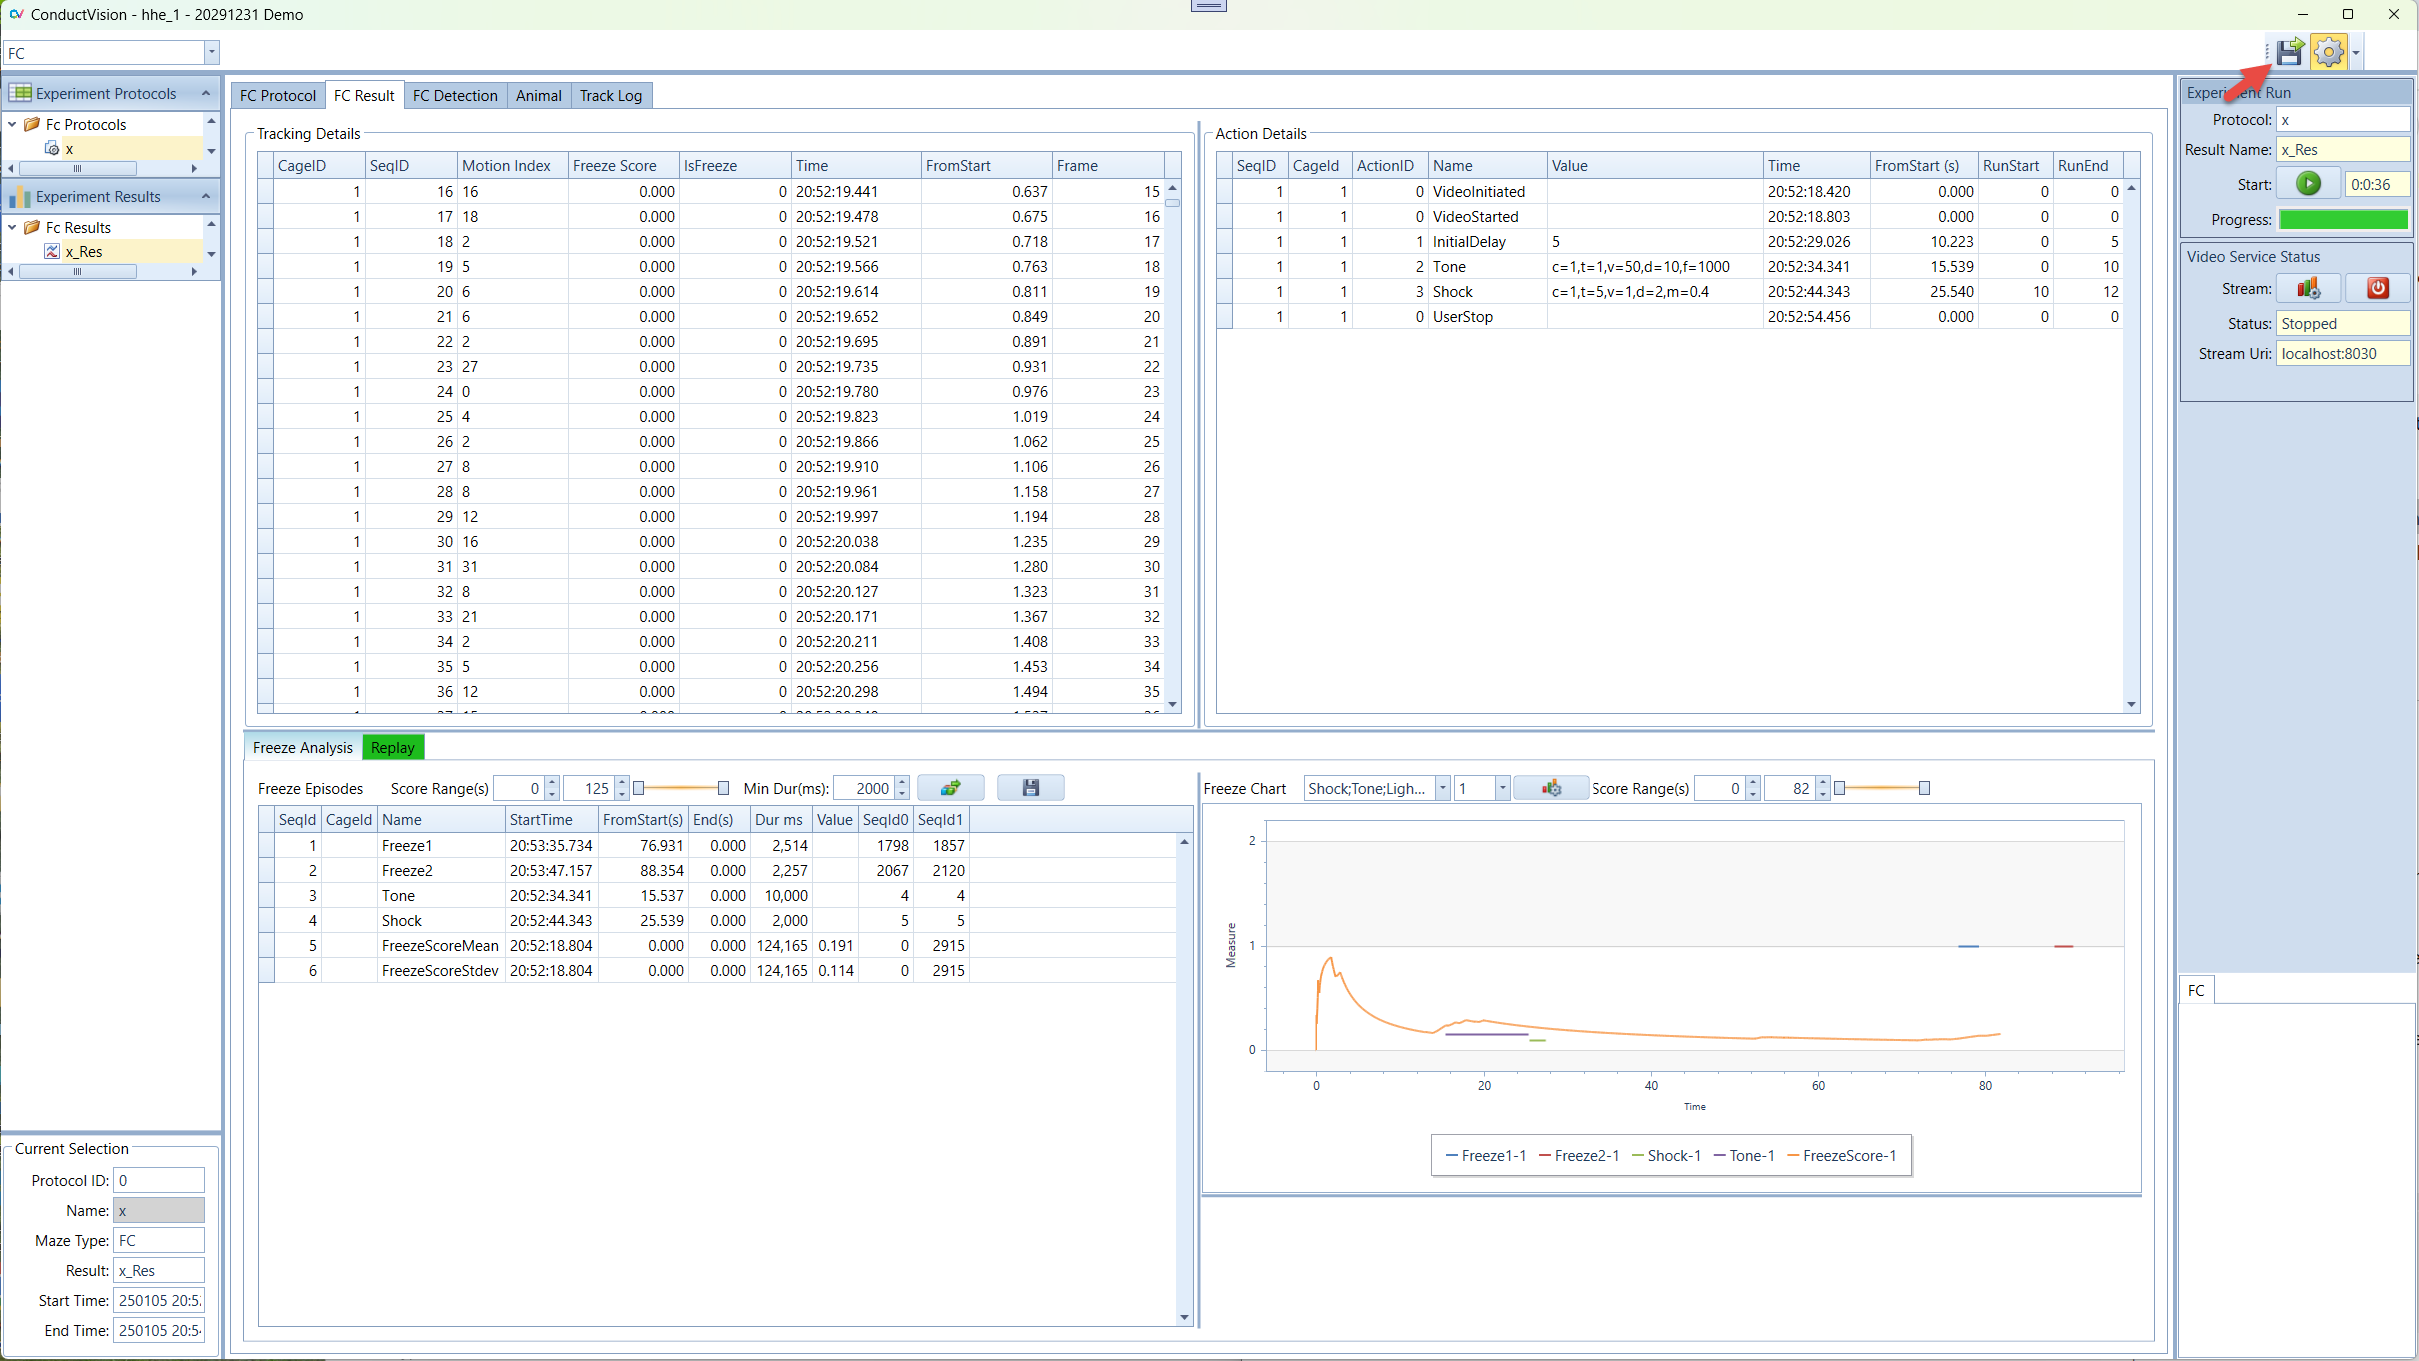
5.2 Result Tables
Select the result from the left "Experiment Result" panel. The results are shown on the Result tab. There are four grids.

5.2.1 Track Details
The table shows the details of each frame:
- Seg Pixels - Represents the pixel change from current frame compared to the previous frame
- Freeze Score - A metric used to quantify the degree of freezing behavior in animals during behavioral studies. It reflects the proportion of freezing (motionlessness) frames
- IsFreezing - Indicates if the frame is a freezing frame. A frame is a freezing frame if the pixel change is less than the predefined small number configured in the property. This parameter is not zero to account for noise
The Freeze Score column and IsFreeze column are not calculated during tracking but will be calculated when the tracking session is completed.
5.2.2 Action Details
The table shows the stimulus action details.
5.2.3 Freeze Analysis
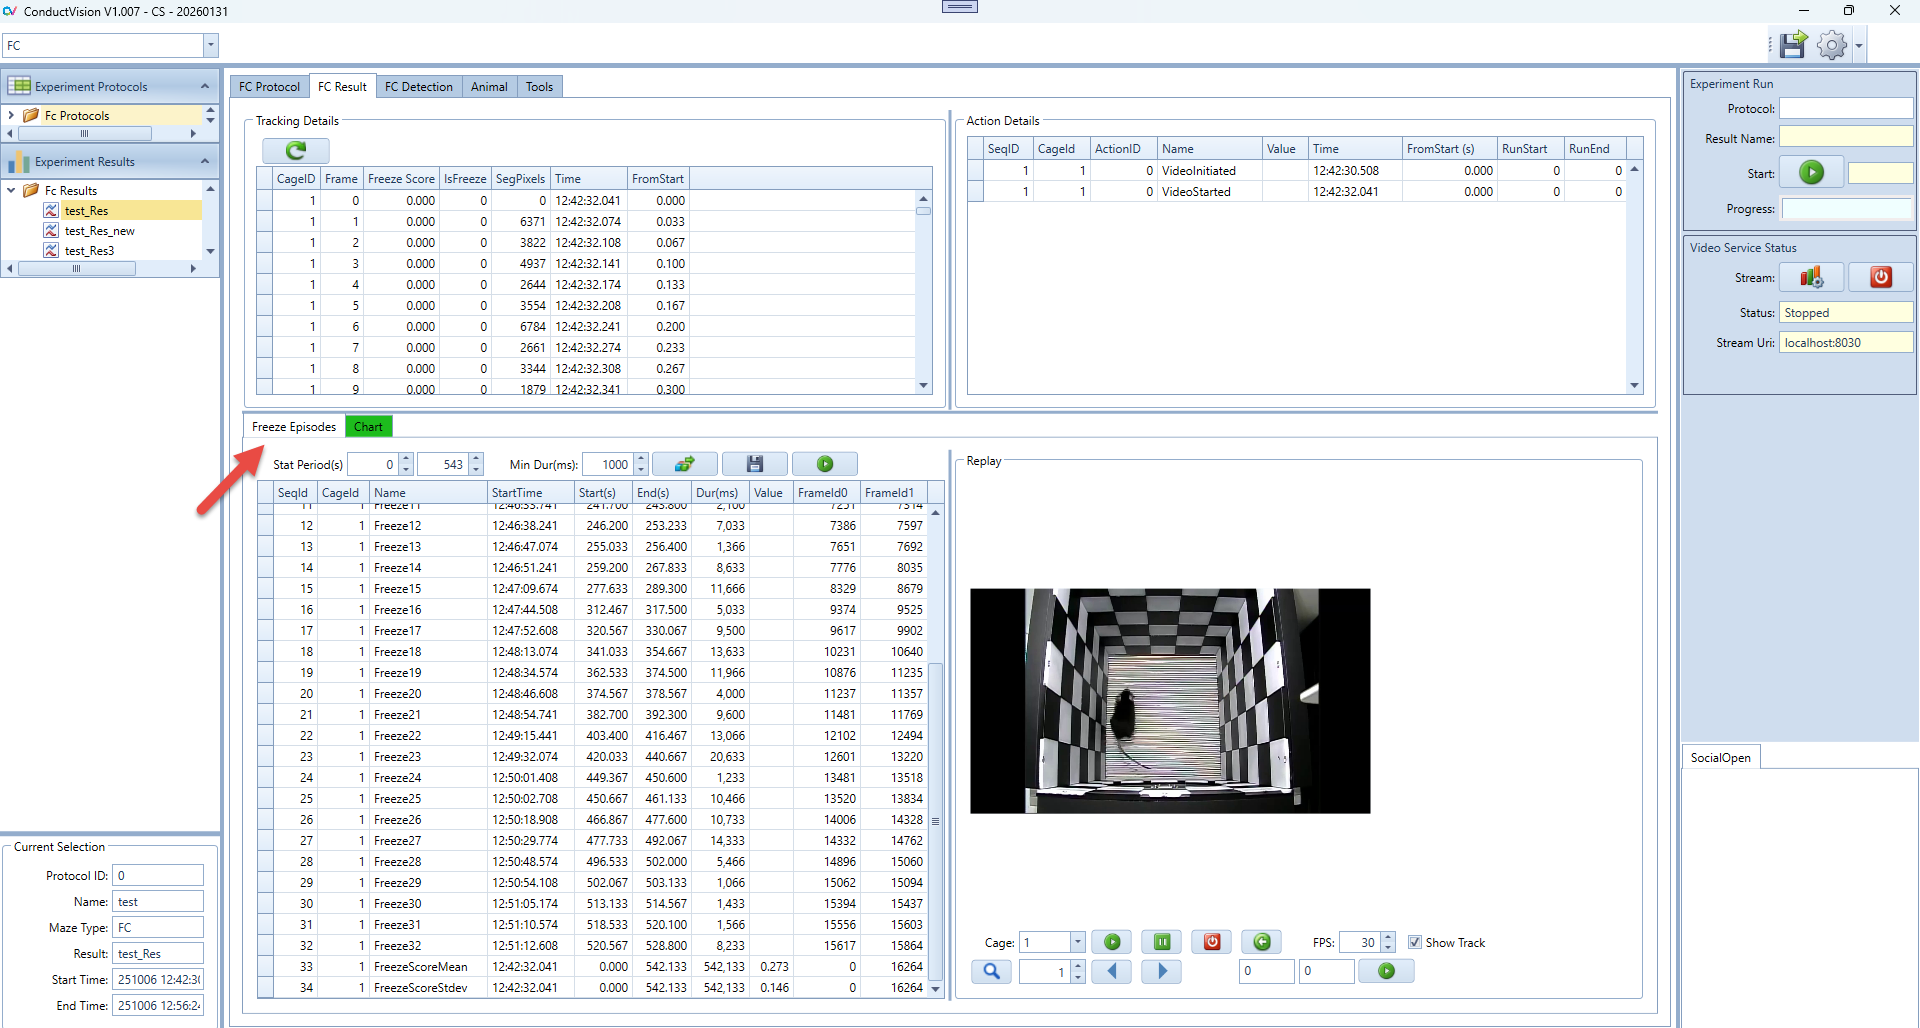
The table shows the freezing episodes and stimulus actions. The synchronized timestamp helps to analyze how an animal's freezing behavior aligns with the presentation of specific stimuli.
Each freeze episode row shows the freeze start time, end time, duration, and corresponding sequence numbers in the tracking detail table above.
- FreezeScoreMean - The mean value of the freeze scores for the entire time range [FromStart, end]. The value is in the column "Value" of the row
- FreezeScoreStdev - The standard deviation of the freeze scores for the entire time range [FromStart, end]. The value is in the column "Value" of the row
The user can choose the time ranges and Freeze Min Duration to recalculate and analyze the freeze episodes.
5.2.4 Freeze Chart
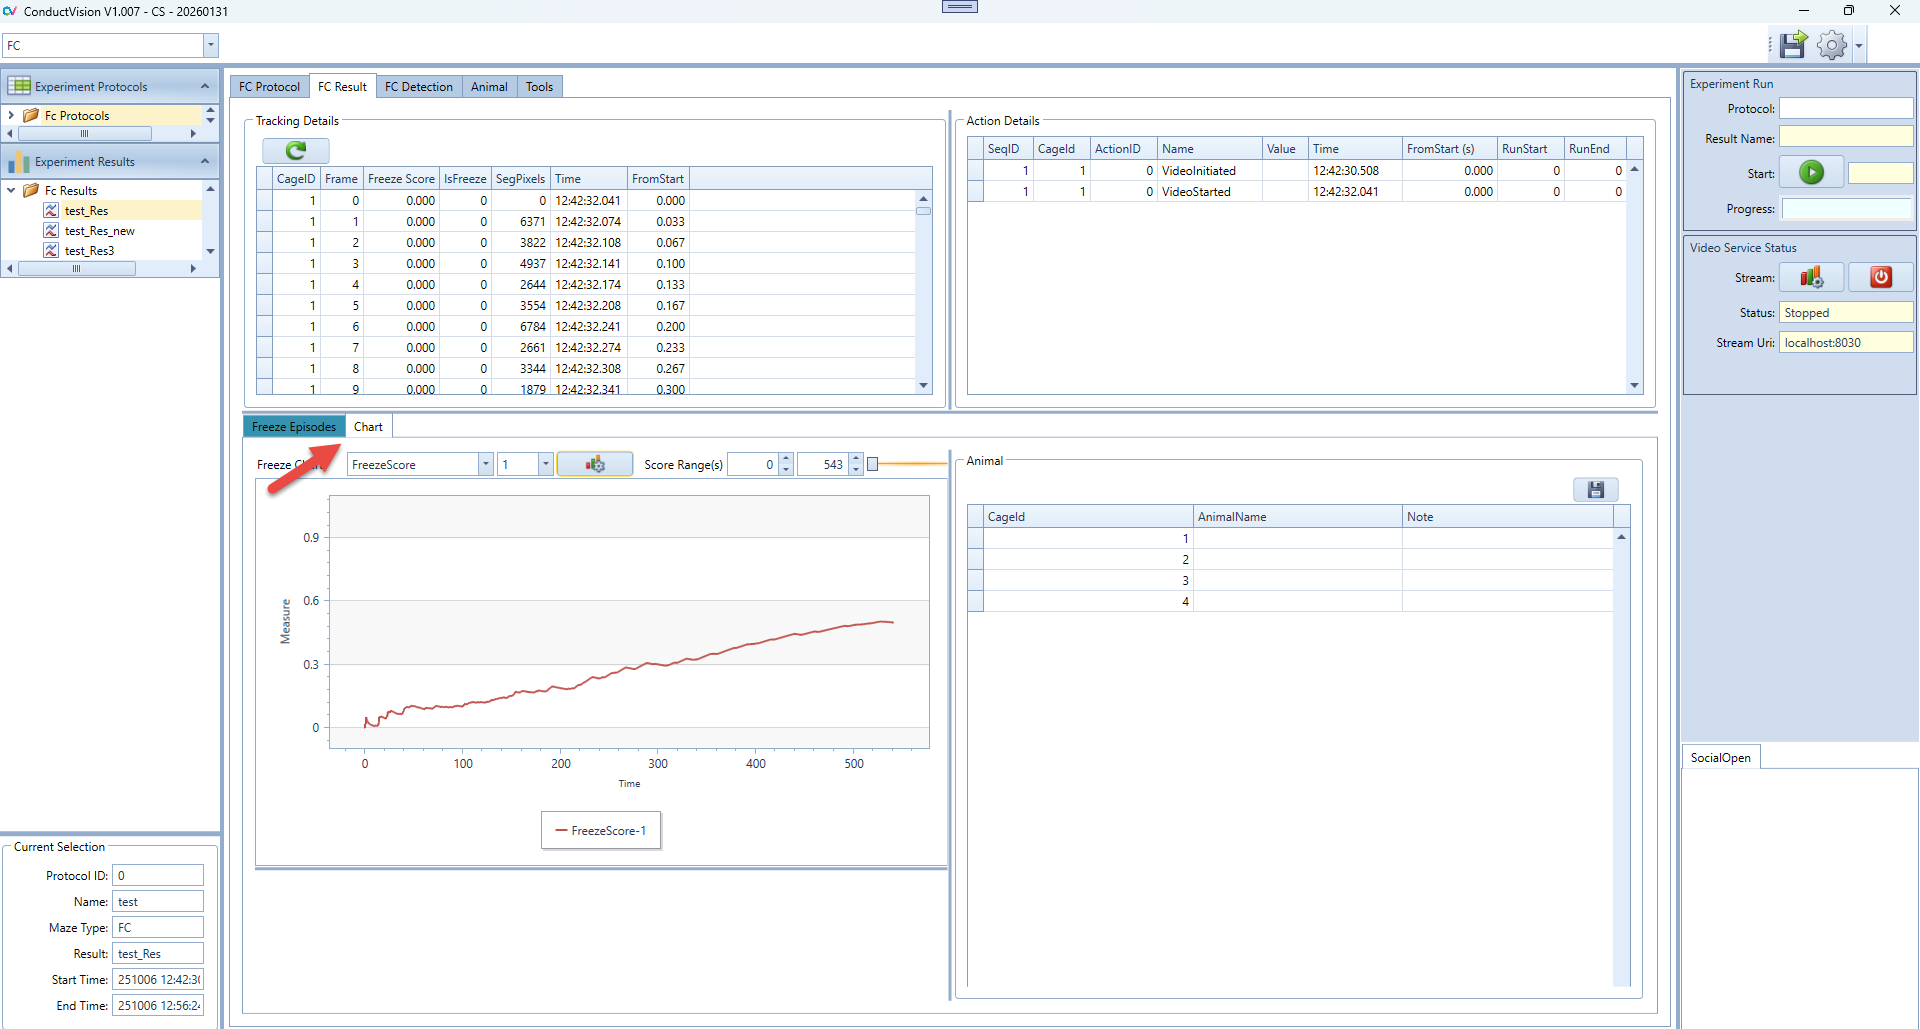
The visualization of freeze episodes, stimuli, and freeze scores based on the Freeze Analysis result. The display time range defaults to the relevant time period from the Freeze Analysis table.
5.2.5 Reset Freezing Parameters
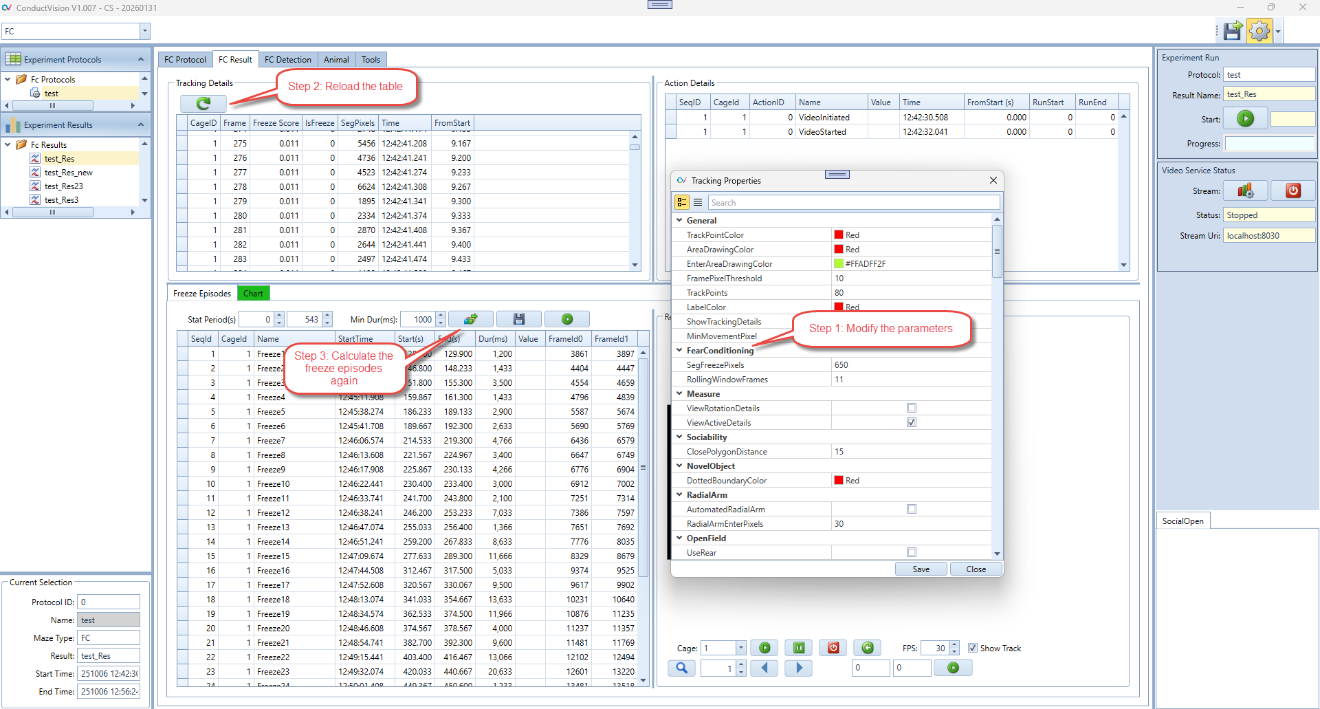
If the results generated by the current freezing parameters are not optimal, the user can adjust the parameters to generate new results.
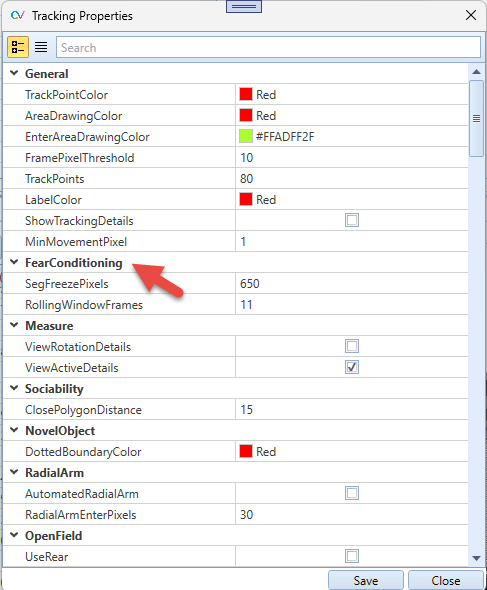
Fear Conditioning Parameters:
- SegFreezePixels - Defines the sensitivity threshold (in pixels) for detecting freezing behavior. Frames where the movement is less than this value are considered potential freezing frames
- RollingWindowFrames - Specifies the number of consecutive frames used for calculating smoothed motion data. A larger window produces smoother results but may reduce responsiveness to short movements
5.3 Video Replay
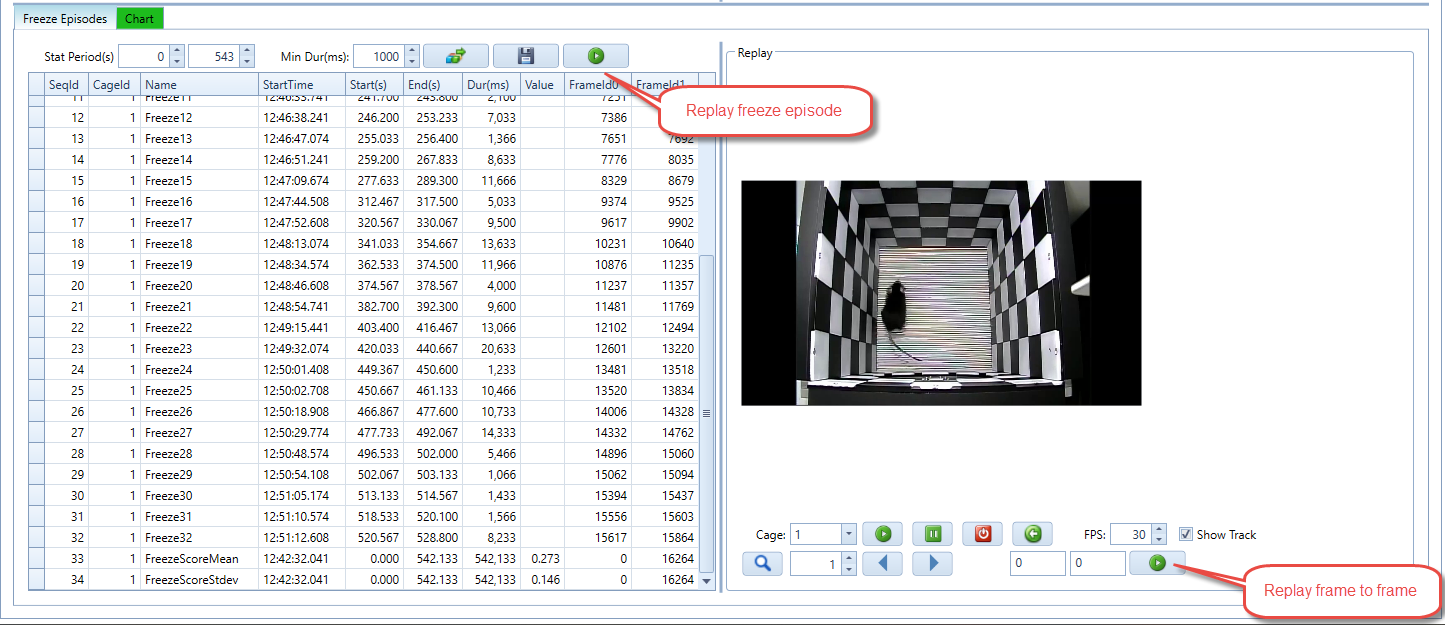
Replay Freeze Episode:
- Click on an episode
- Click "Replay Freeze Episode"
- The selected freezing episodes will be displayed in the video replay panel
Replay Frame to Frame: Allows the user to define a specific frame range for replay.
The user can replay the tracking video at a slow speed to observe the animal behavior.
5.4 Main Steps
5.4.1 Hardware and ConductAdapterUI
Step 1: Connect hardware components and connect the USB cable from the computer to the control box
Step 2: Start hardware control box and connect to the COM port
Step 3: Start ConductAdapter and test the hardware functionality using manual commands from ConductAdapterUI
5.4.2 ConductVision
Step 4: Run ConductVision software and set up a protocol with the parameters. The parameters include video parameters and protocol stimulus parameters
Step 5: Run the protocol. Make sure the commands are properly sent to the ConductAdapterUI
Step 6: Review the result
6. Conduct Adapter
Workflow:
- ConductVision sends commands to ConductAdapter
- ConductAdapter controls the experiment automation sequence
6.1 Conduct Adapter Software Installation
- Maze Engineers software ConductAdapter is a light-weight adapter for ConductVision to control the execution of the Fear Conditioning Hardware
- The executable ConductAdapterUI is a light-weight Windows UI application that needs to start before experiments
- The application accepts commands from ConductVision and controls the execution of the commands
6.2 Start ConductAdapterUI
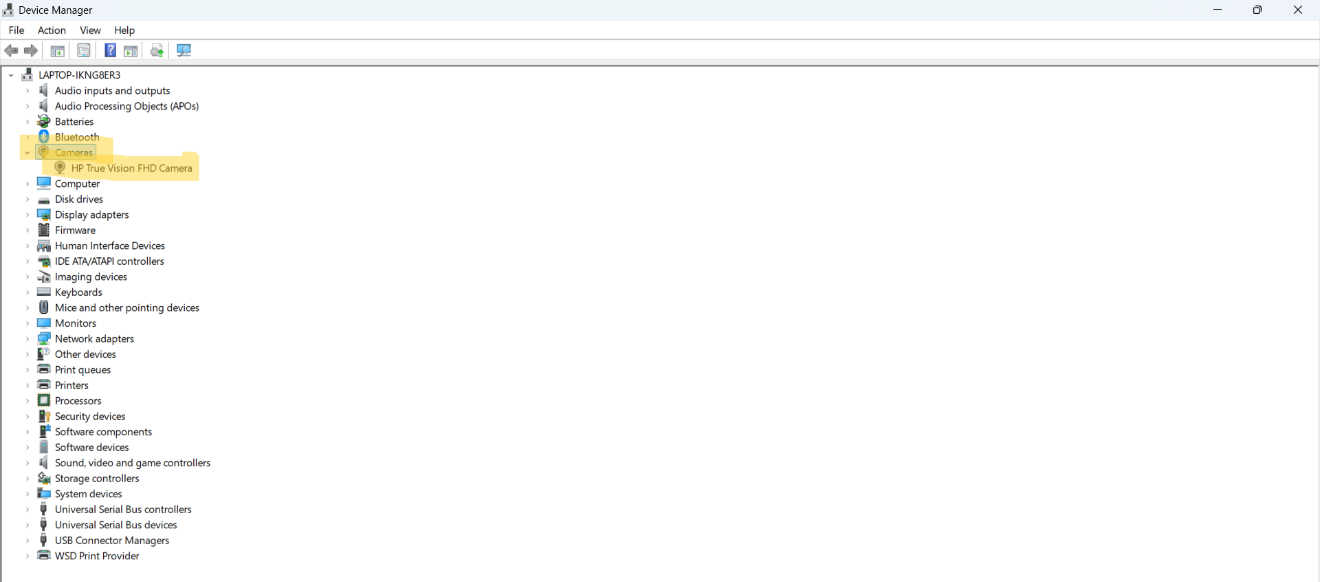
Step 1: When the micro-controller is connected to your computer, a port is created as shown on the Device Manager:
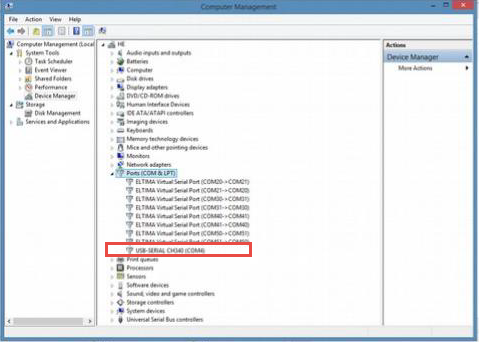
If the device is not shown on the Ports section, it will appear on a different section. This is because the computer could not find the driver for the hardware device. In this case, you will need to install the driver (small disc in the box of UNITEK) which is included in shipment. A digital version of the USB driver is included in shipment so that you would not need a CD reader.
For Windows 11, the driver install appears to be unnecessary.
Step 2: Start ConductAdapterUI
Double click on ConductAdapterUI, the main window appears as below:
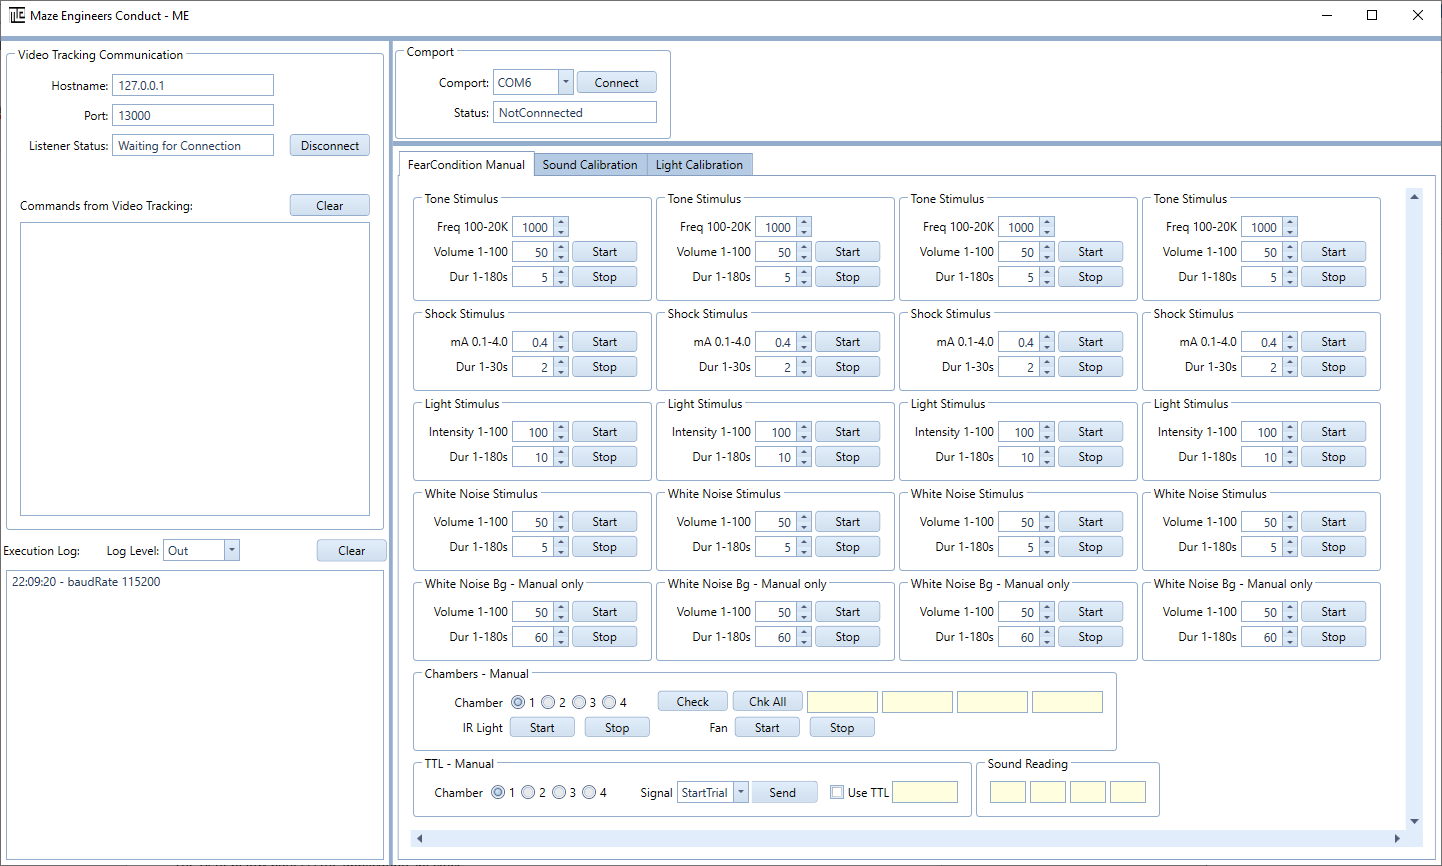
Step 3: Connect to COM port
Once your computer recognizes the hardware, choose the COM port that matches the one on the Device Manager, and then click on Connect button.
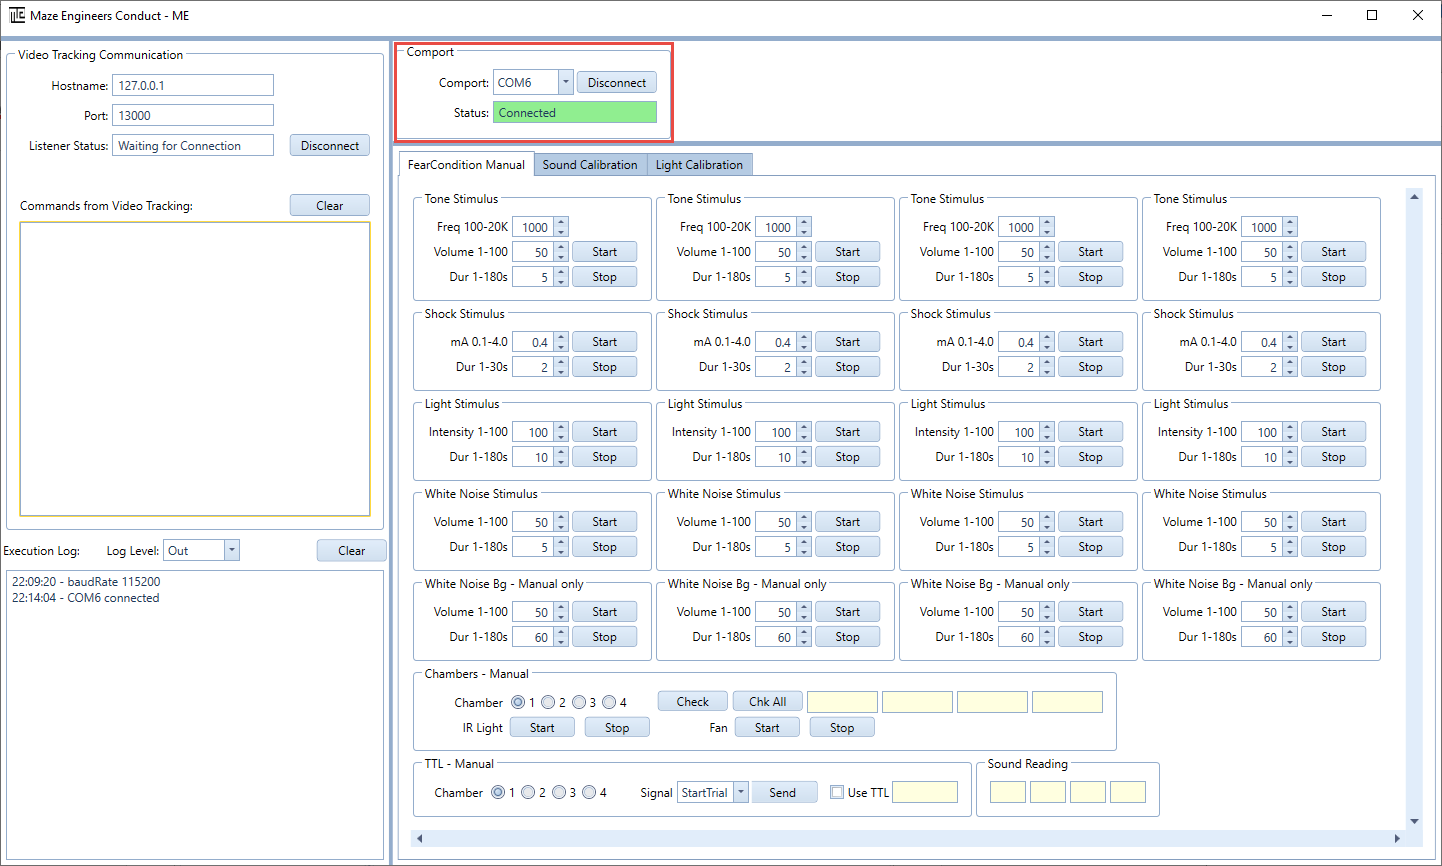
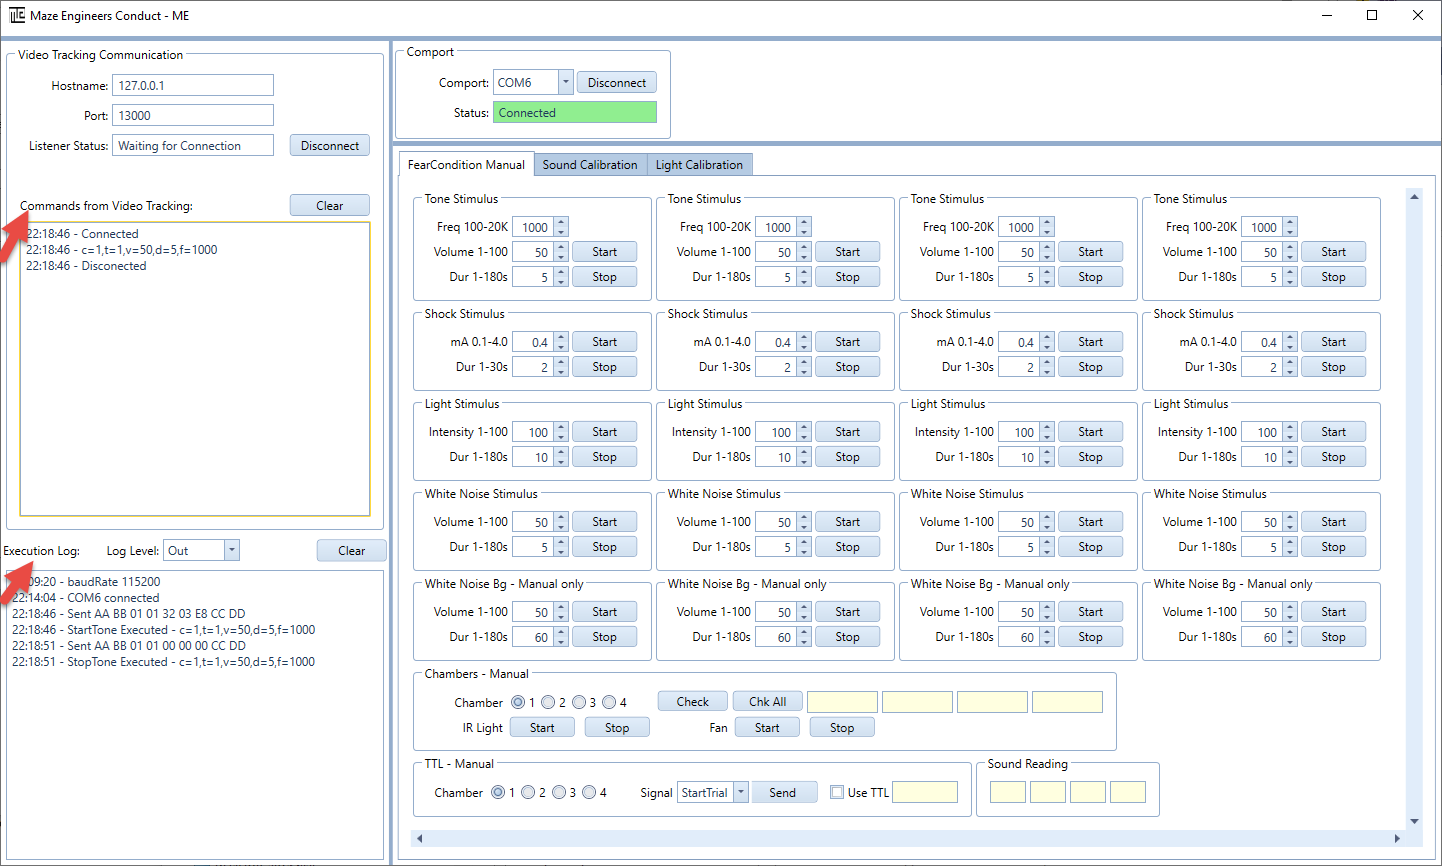
6.3 Execution Status on ConductAdapterUI
When the experiment runs, the External Command Action is invoked, and the command is sent to ConductAdapterUI.
- Left upper panel - Command from ConductVision is logged
- Left lower panel - Command execution status is logged
- Right main panel - Provides functionality for users to send manual commands to the automated maze for testing purposes
ConductAdapterUI can be minimized if you don't need to monitor the status.
6.4 Fear Conditioning Commands
6.4.1 Command Parameters
Command parameters for ConductVision video tracking. They are automatically built in the ConductVision protocol panel. They are listed here for information purposes so you can see the command flow from ConductVision to the ConductAdapter.
| Type | Message Type | Start Command Example | Stop |
|---|---|---|---|
| Frequency tone | t=1 | c=1,t=1,v=50,d=5,f=1000 | c=1,t=1,v=0 |
| Light | t=2 | c=1,t=2,v=30,d=5 | c=1,t=2,v=0 |
| Shock | t=5 | c=1,t=5,v=1,d=5,m=0.4 | c=1,t=5,v=0 |
| White noise | t=6 | c=1,t=6,v=50,d=10 | c=1,t=6,v=0 |
| StartTrial | t=8 | c=1,t=8 | |
| EndTrial | t=9 | c=1,t=9 |
Parameter Definitions:
- c - Chamber (1, 2, 3, or 4)
- t - Message types:
- 1: Frequency tone
- 2: Light
- 5: Shock
- 6: White noise
- 8: StartTrial (for TTL signal only)
- 9: EndTrial (for TTL signal only)
- v - Volume (0-100)
- d - Duration (0-180)
- f - Frequency (100-18000)
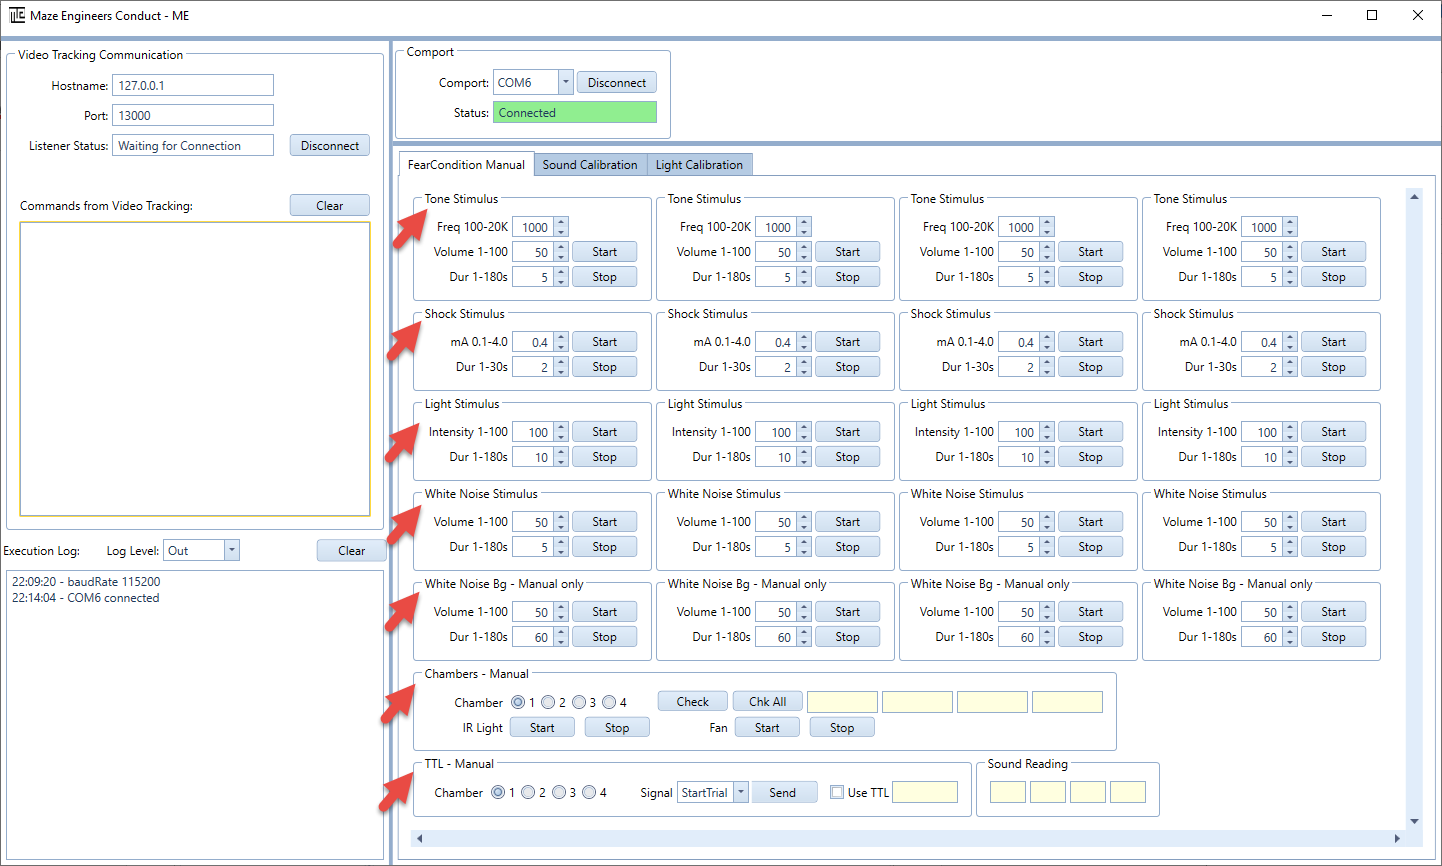
6.5 Manual Operations
For testing purposes, the software allows the user to send commands manually (connection has to be established).
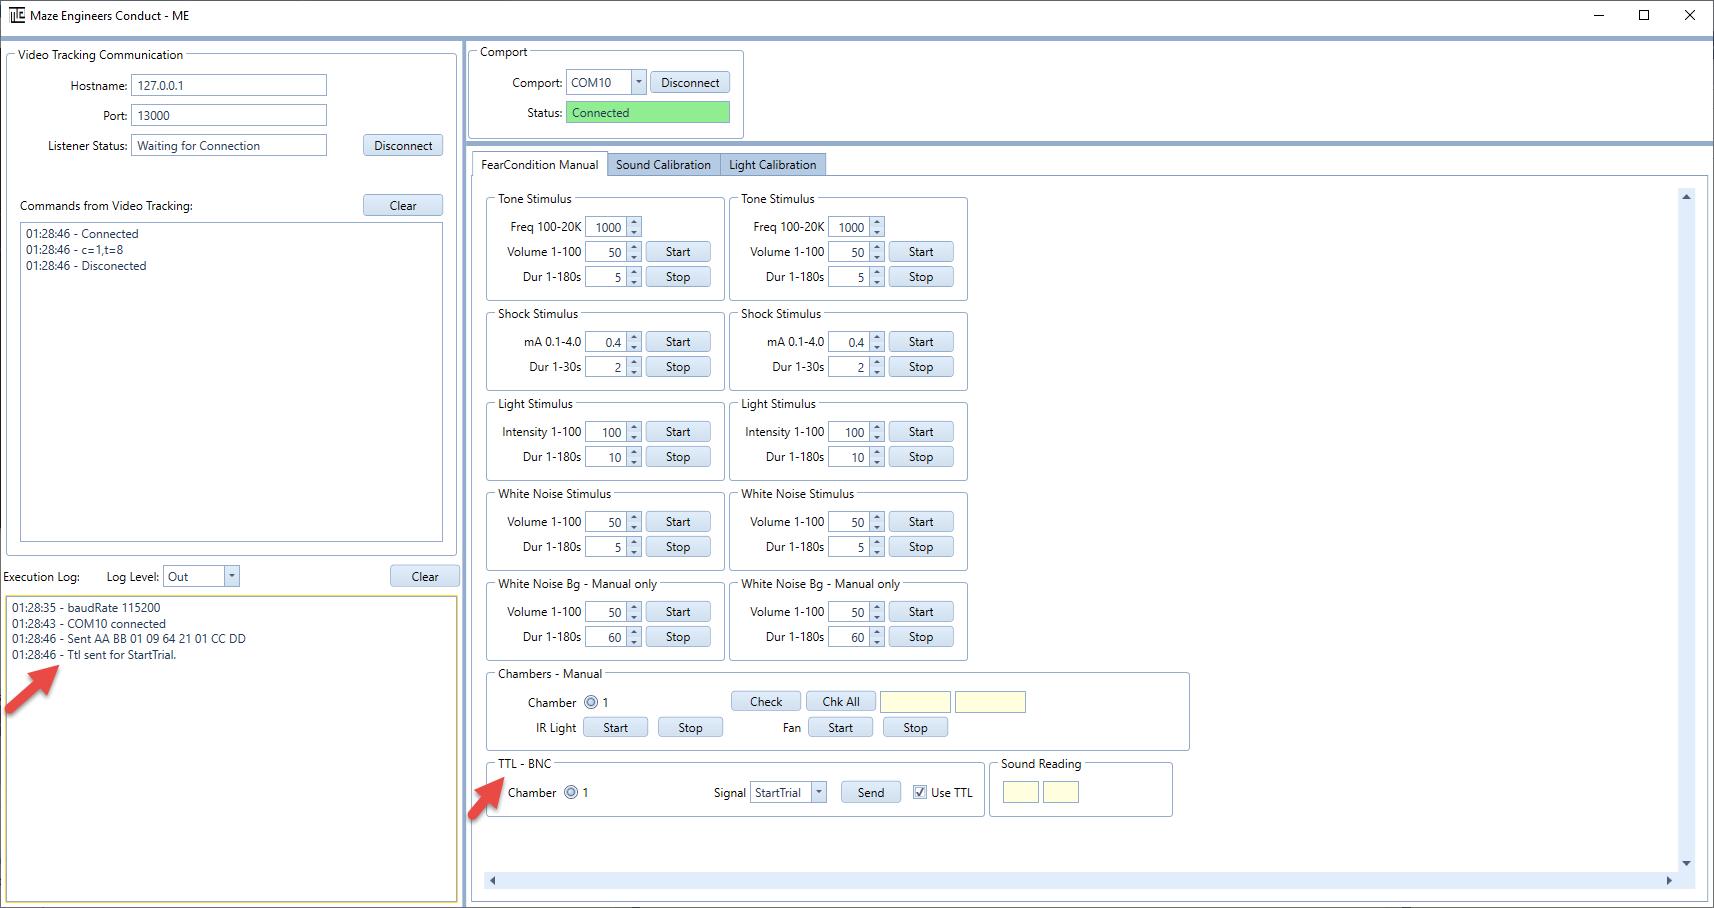
6.6 TTL
By default, a BNC TTL connector is equipped. The user can send StartTrial and EndTrial signals to external devices. The TTL connection is between the control box and the external device(s).
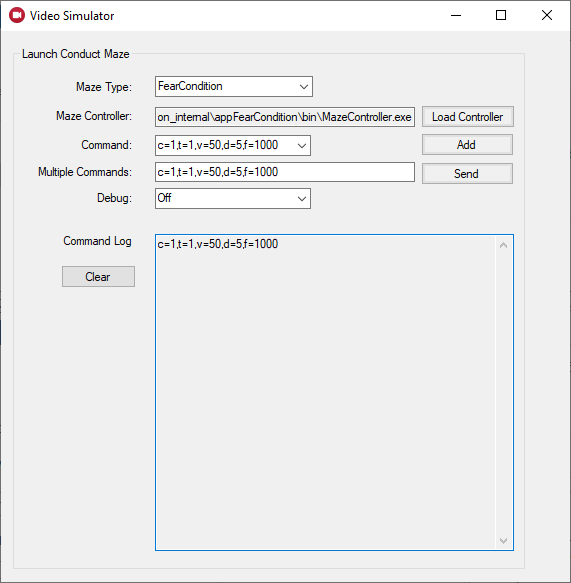
6.7 Conduct Vision Simulator for Testing
For testing purposes, the executable VideoSimulator can be invoked to generate commands to ConductAdapterUI software.
7. Multiple Cages
The number of cages is defined in the ConductVisionUI configuration file.
8. Properties
Fear Conditioning Parameters:
- SegFreezePixels - Defines the sensitivity threshold (in pixels) for detecting freezing behavior. Frames where the movement is less than this value are considered potential freezing frames
- RollingWindowFrames - Specifies the number of consecutive frames used for calculating smoothed motion data. A larger window produces smoother results but may reduce responsiveness to short movements
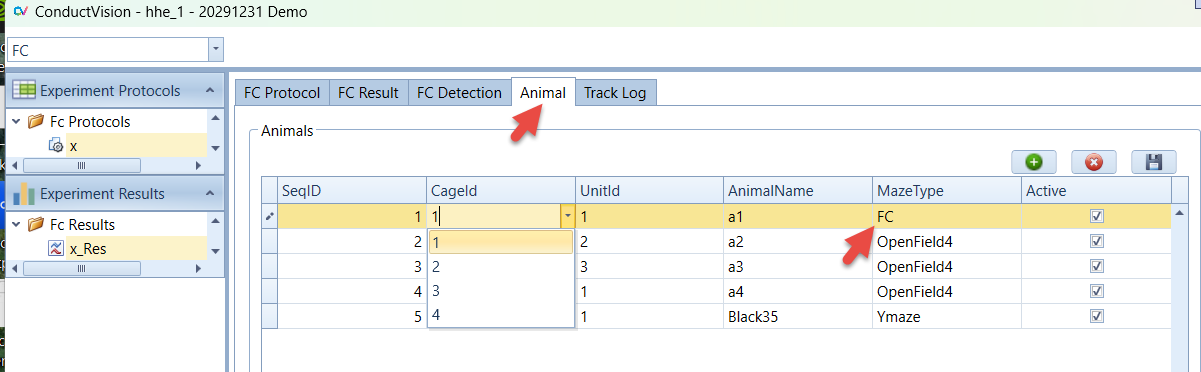
9. Animal
The tab provides a place for the user to enter animal information. The animal information is then applied to the results.
10. Export Data
Steps to export data:
- Select a result
- Click the Export button
- The output file format is .csv
11. Troubleshooting
11.1 Log Display
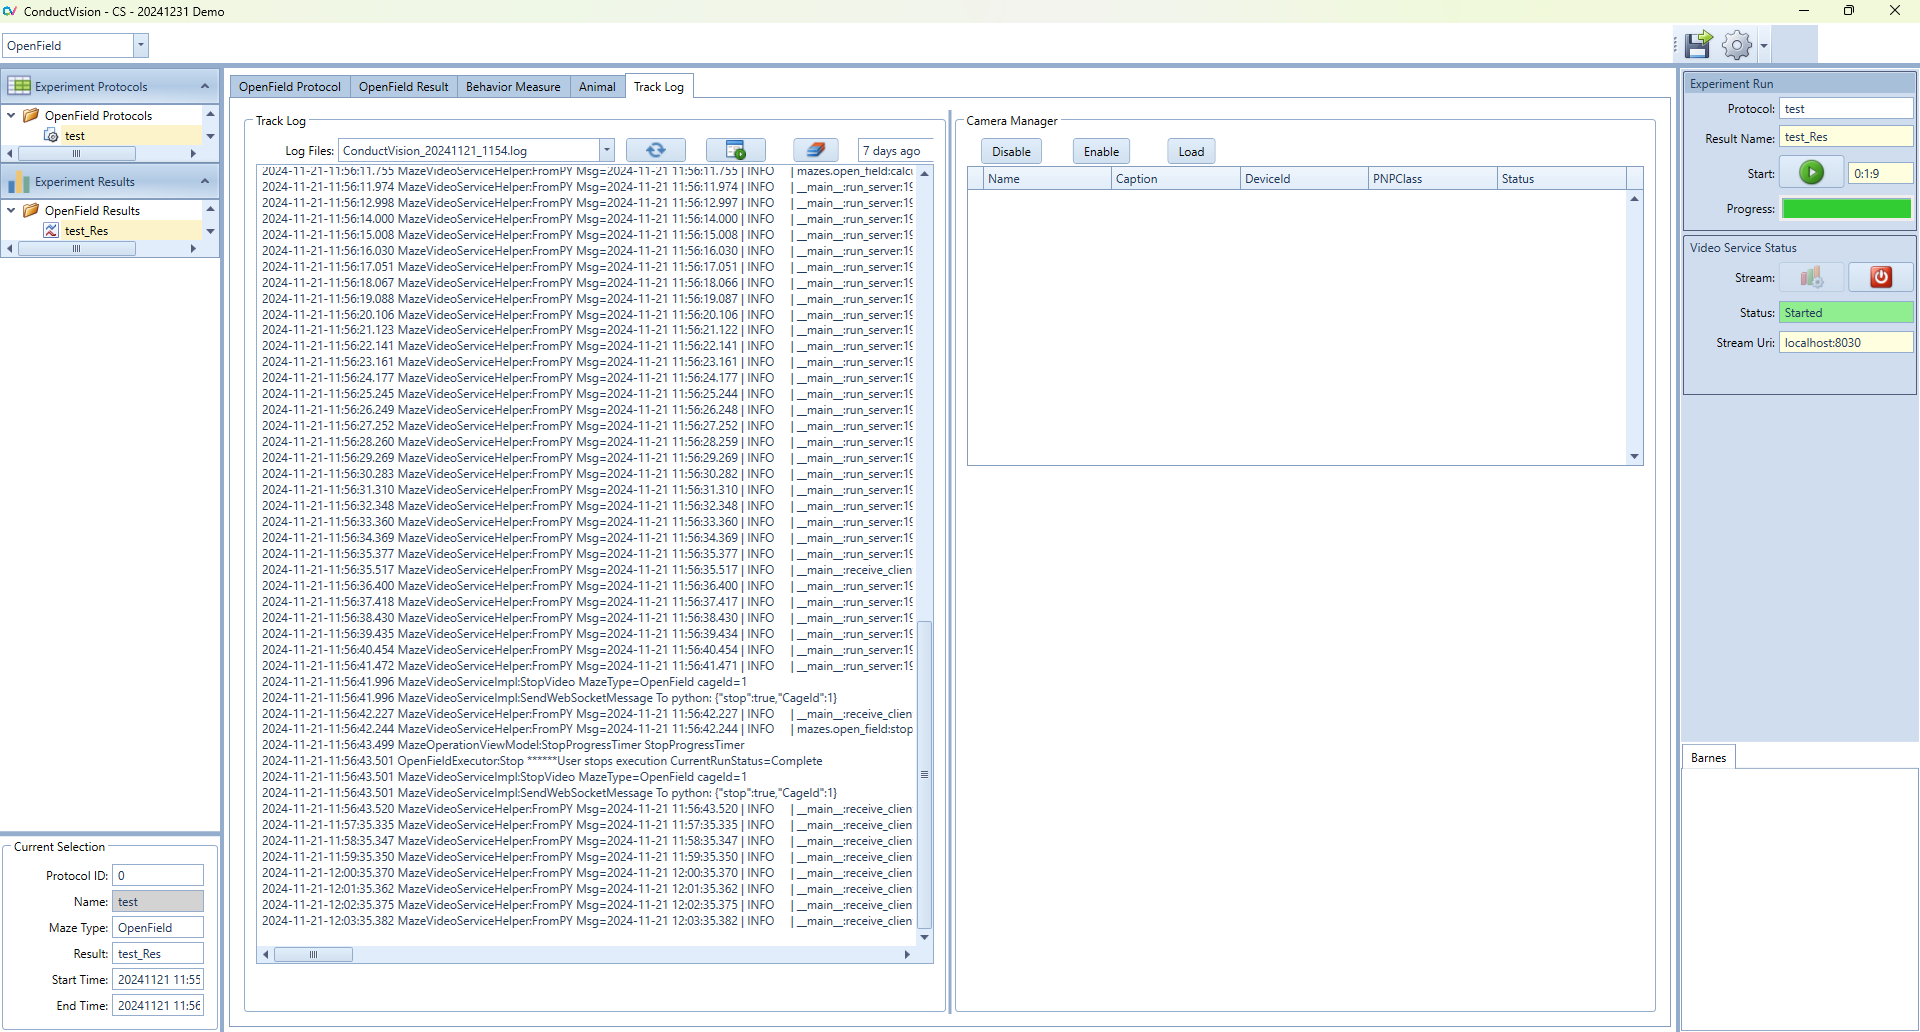
- The log content can be displayed on the screen
- Each time ConductVisionUI starts, it creates a new log file
11.2 Database Files and Media Data
Two folders of database and media are generated during operation.
For ConductVision support to replicate your tracking operation, the following data are needed:
- Your video file if the source is Video File
- Log files
12. License
Demo version: The demo version is valid for one month from the download and no license is required.
For us to generate a license, you will need to provide us with two machine names where ConductVision software is intended to run.
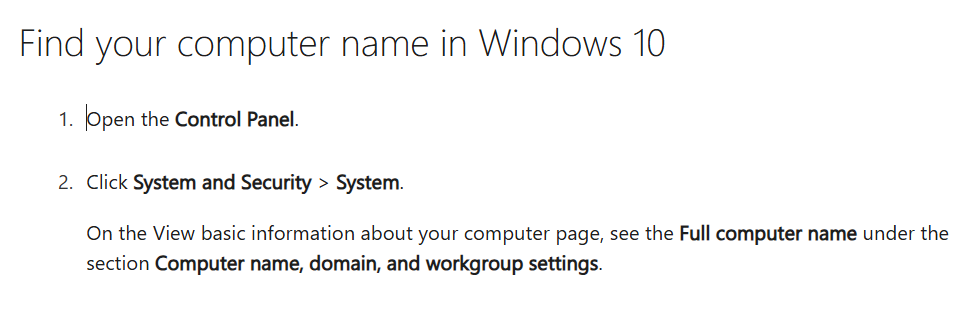
There are two ways to find the computer name:
Method 1: From Control Panel (works for Windows 10 and Windows 11)
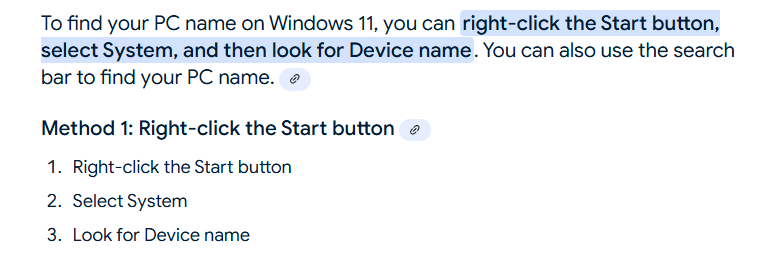
Method 2: For Windows 11, from Start button → System → About
13. Camera Setup
If one of our provided cameras is used, no drivers or software is required for the camera to function.
Setup Steps:
- Disable any other cameras on the computer under "Device Manager"
-
Plug the camera into the computer's USB port. You should hear a noise to indicate the computer has recognized the camera
-
Open the computer's camera app to confirm the camera's connection and adjust the camera's view
-
Either record subject trials in advance using your computer's camera app or open the ConductVision app for live streaming