ConductVision Software Manual
Contents
1. Install and Run Application 7
1.1 Software Installation 7
1.2 --- 7
2. Maze Types 7
3. Video Service Connection 8
4. Experiment Configuration 9
4.1 New Experiment 9
4.2 Configure Parameters 11
4.2.1 Protocol Parameters 11
4.3 Area drawing 11
4.3.1Drawing a Rectangle 12
4.3.2 Drawing a Polygon 12
4.4 Ruler 13
5. Experiment Run 14
5.1 Run Experiment 14
5.2 Result Tables 15
5.3 Specific Protocol Result Tables 16
6. Common Behavior Measurements 16
6.1 Temporal Move Measurement 16
6.2 Rotation Measurement 17
6.2.1 Rotation Episodes 17
6.2.2 Algorithm for Rotation Calculation 17
6.2.3 Rotation Details 18
6.3 Activity Measurement 19
6.3.1 Active and Inactive Episodes 19
6.3.2 Algorithm for Active and Inactive Calculation 20
6.3.3 Active and Inactive Details 20
6.4 Angle Measurement 21
6.4.1 Meander or Angular Velocity 21
6.5 Heatmap 22
6.5.1 Animal Tracking Data Heat Map 22
6.5.2 Heat Map Calculation 22
6.5.3 Heat Map Image Export 23
7. Other Common Functionalities 23
7.1 Animal 23
7.2. Export Data 24
7.2.1 Example Csv File 25
7.3. Troubleshooting 27
7.3.1 Log display 27
7.3.2 Database files and user data 27
7.4. --- 27
7.5. Camera Setup 28
8. Y-Maze Protocol 29
8.1 Y-Maze Spontaneous Alternation 29
8.1.1 Y-Maze Alternation Specification 29
8.1.2 Y-Maze Alternation Result 30
8.1.3 Y-Maze Alternation Calculation and Interpretation 31
8.1.4 Y-maze Reentry Calculation 32
8.1.5 Result Verification 33
8.2 Video Batch Processing 33
8.2.1 Batch Track Params 34
8.2.3 Batch Videos 34
8.2.3 Video Batch Processing Results 35
8.2.4 Key Steps 35
8.3 Arm Entry Double Lines 36
8.3.1 Arm Entry Detection 36
8.3.2 From Center to Arm 36
8.3.3 From Arm to Center 37
8.3.4 Line Distance Parameter 37
9. Radial Arm Maze Protocol 38
9.1 Radial Arm Maze Alternation Protocol 38
9.1.1 Radial Arm Maze Alternation Specification 39
9.1.2 Radial Arm Maze Alternation Result 40
9.1.3 Radial Arm Maze Alternation Calculation and Interpretation 42
9.2 Radial Arm Entry Double Lines 42
9.3 Automated Radial Arm 43
9.3.1 Automated Radial Arm Maze Hardware 43
9.3.1 Enable Automation 44
9.3.2 Rmaze Parameters 44
9.3.3 Maze Controller 45
9.3.4 Rmaze Execution Results 46
9.4 Rmaze Conduct Adapter 46
9.4.1 Conduct Adapter Software 46
9.4.2 Start ConductAdapterUI 47
9.4.3 ConductAdapterUI Permission 48
10. T-maze Protocol 48
10.1 T-maze Alternation Protocol 48
10.1.1 T-maze Spontaneous Alternation 48
10.1.2 T-maze Forced Choice 48
11. Open Field and Open Field4 Protocol 48
11.1 Open Field & Open Field4 Thigmotaxis Measurement 48
11.1.1 Arena Setup 48
11.1.2 Key Behavioral Metrics: 49
11.1.3. Summary Result 49
11.2 Open Field Rearing Behavior Analysis 50
11.2.1 Rearing Protocol Setup 50
11.2.2 Result Analysis 51
11.3 Video Batch Processing 53
11.3.1 Batch Track Params 53
8.2.3 Batch Videos 54
11.2.3 Video Batch Processing Results 55
11.2.4 Key Steps 55
12. Novel Object and Novel Object 4 Protocol 55
12.1 Novel Object Area Drawing 55
12.1.1 Drawing Shapes 55
12.1.2 Draw Oval and Rectangle 56
12.1.3 Draw Polygon 56
12.1.4 Move Polygon 57
12.1.5 Edit Polygon 58
12.2 Novel Object & Novel Object 4 Exploration Protocol 59
12.1.1 Novel Object Exploration Protocol Setup 59
12.2.2 Exploration result analysis 59
12.2 Video Batch Processing 59
12.2.1 Batch Track Params 60
12.2.3 Batch Videos 60
12.2.3 Video Batch Processing Results 61
12.2.4 Key Steps 61
13. Elevated Plus Maze Protocol 62
13.1 Elevated Plus Maze Head Dip Analysis 62
13.1.1 Head Dip Region 62
13.1.2 Protocol Setup 62
13.1.3 Head Dip Result Table 63
14. Barnes Maze Protocol 63
14.1 Barnes Maze Zone Analysis 63
14.1.1 Barnes Maze Zones 63
14.1.2 Barnes Maze Zone Entry Details 64
14.1.3 Barnes Maze Zone Entry Logic 65
14.1.4 Barnes Maze Zone Summary 66
15. Zero Maze Protocol 67
15.1 Zero Maze Head Dip Analysis 67
15.1.1 Head Dip Region 67
15.1.2 Protocol Setup 68
15.1.3 Head Dip Result Table 69
16. Light Dark Maze Protocol 69
17. Water Maze Protocol 69
17.2 Video Batch Processing 69
17.2.1 Batch Track Params 70
17.2.3 Batch Videos 70
17.2.3 Video Batch Processing Results 71
17.2.4 Key Steps 71
18. Sociability Maze Protocol 72
19. Open Field Grooming Protocol 72
19.1 Grooming in Open Field 72
19.2 ConductVision Machine Learning Technologies 72
19.3 Why Bottom-Up Helps 72
19.4 Open Field Grooming Protocol Setup 73
19.5 Open Field Grooming Results 73
19.5.1 Tracking Details and Replay 74
19.5.2 Grooming Episodes 74
19.5.3 Grooming Heatmap 76
19.5.4 Grooming Patterns 76
20. Open Field Gait Analysis 76
20.1 Gait Analysis in Open Field 76
20.2 ConductVision AI and Machine Learning Technologies 77
20.3 Why Bottom-Up Helps 77
20.4 Open Field Gait Protocol Setup 77
20.5 Open Field Gait Analysis Results 78
20.5.1 Tracking Details and Replay 78
20.5.2 Paw Details 79
20.5.3 Gait Parameters 80
20.5.4 Gait Coordination 81
20.5.5 Naming Convention 82
20.6 Open Field Gait Analysis Visualization 82
20.6.1 Paw and Body Trajectory 83
20.6.2 Stride Detail Chart 83
20.6.3 Paw Contact Chart 84
20.6.3 Stride Cycle Chart 84
20.6.4 Phase Difference Chart 85
20.7 Open Field Gait Sub-Selected Data Group 86
20.7.1 Create Data Groups 86
20.7.2 Create Data Groups for Calculation and Visualization 86
20.8 Fixing Bad Tracking Key Points 87
20.8.1 Fixing Bad Tracking Key Points 87
20.8.2 Editing Bad Tracking Key Points 87
20.8.3 Reversing Manual Key Point Corrections 88
1. Install and Run Application
1.1 Software Installation
ConductVisionF\ConductVisionPy
ConductVisionF\ConductVisionUI
The executable is ConductVisionUI\bin\ConductVisionUI. Double click on the executable. The application appears as below:
1.2 ---
2. Maze Types
Click on the maze type field to view or select a maze type. You can switch to another maze without having to restart the application.
The ConductVision software supports maze types defined in the packages: PackMaze, PackMazeAdvance
- PackMaze: Barnes, Light-Dark, Novel Object, OpenField, OpenField4 (Open Field Set of 4), Elevated Plus, Radial Arm, T-maze, Y-maze, Sociability, Water Maze U-Maze (User defined maze), Fear Conditioning, Social Open, Open Grooming, Open Gait, Open Unsupervised, Horizontal Ladder, Balance Bean and many more to come
- PackFish: Zebrafish
- PackFly: Fly
- PackAdvanced: Automated Radial Maze, Active Place Avoidance, Looming Visual and many others
3. Video Service Connection
To use AI based video tracking service, the user needs to start the service stream. When the service stream is established, the status field shows text Started and color becomes green. If there is a need to stop the stream because of the exception, click on the stop button and then start again.
When the application starts, it is in the stop state.
The stream uses local machine ---. It is usually available for users. If the port is blocked, please contact your system administrator to open the port.
4. Experiment Configuration
The application provides a user interface to configure and execute experiments (protocols) and view execution results.
4.1 New Experiment
To create an experiment protocol, click on "OpenField Protocols" on the left panel. A menu item New appears as shown below:
If a different maze like LightDark is selected, the protocols will be “LightDark Protocols”.
Click on New menu item, a "New Experiment" window appears as shown below. Fill in an experiment name and click on Save button.
Once the experiment is created, it appears in the folder "OpenField Protocols" as shown below:
An experiment can be deleted by the right click on the experiment. The current active protocol is indicated in the left bottom of the screen.
4.2 Configure Parameters
To configure an experiment, double click on the experiment under the folder "OpenField Protocols".
4.2.1 Protocol Parameters
- Trials (1-30) - represents the number of the trials to continuously run in the session
- Trial Durs(s) - represents the trial duration in seconds
- Auto Trial – If selected, the next trial will automatically start after the completion of a trial. If not selected, a dialog will appear asking the user to place the animal in the starting position before starting.
- Video Source Video file - to track a video file, the user needs to load a video file.
- Video Source camera – this is to track rodent in real-time
- Preview – in living tracking mode, the user can preview the maze; stop preview will produce a thumbnail that can be used for drawing the tracking areas.
- Track Part – the user can choose the track part, either head or body. Some mazes only allow head tracking.
4.3 Area drawing
There are two styles of drawing: rectangular area and polygon.
Rectangular area drawings include
- Barnes
- Light-Dark
- Novel Object
- OpenField
- OpenField4 (Open Field Set of 4)
Polygon area drawings include
- Elevated Plus
- Radial Arm
- T-maze
- Y-maze
- User defined maze
4.3.1Drawing a Rectangle
- Click Button in the Open Field Drawing group to enable the drawing mode.
- Select NRow and NCol
- On the maze, select the point on the left-up corner and drag to the right bottom inside the maze
- After the drawing, click Save button on Drawing Data group.
4.3.2 Drawing a Polygon
- Enable Button in Radial Arm Drawing group to enable drawing mode
- Select a radial arm
- Click four points of an arm to form a polygon
- After the drawing, click Save button on Drawing Data group.
4.4 Ruler
In software, the camera image distance is defined as pixels. We are interested in reporting distance meters like cm. So, we need to know the pixels distance on screen maps to meter distance cm.
- Click on the Show Ruler button, and a line appears on the maze
- Draw the ends of the line to two end points of the maze
- Enter the real distance in the field.
- Click Save button to save the data
5. Experiment Run
To execute an experiment, select the protocol under "Protocols" on the left navigation panel and double click on it. Make sure the service stream is connected.
5.1 Run Experiment
Enter a name for the experiment run and click Start button. This will set system in the running state.
When the start button is clicked, the state of button becomes stop. Users can click on a stop button to stop the session run.
The experiment will stop when total time reaches, or all trials are completed, or the user stops it.
In the Video Tracking group, the animal moves are tracked.
In the Tracking Details group, the track details are recorded. The data grid only should be the latest trial. When a trial is completed, the tracking data is saved.
5.2 Result Tables
Select the result from the left Experiment Result. The results are shown on the Result tab. There are five grids.
Current Result Status: show the protocol name, result name, protocol run start time, complete time and run status
Replay Group: it allows user to replay the video at a user defined speed (frame per second)
Replay Details: displays frame-by-frame activity data, including position coordinates, timestamps, and related tracking information for each step of the recorded trial.
- TrialID: shows the identification number of the trial the frame belongs to.
- SeqID: shows the sequence number indicating the order of recorded actions.
- FrameID: shows the frame index within the video or tracking sequence.
- GridID: shows which arena area (grid cell) the animal was located in at that frame.
- X: shows the animal’s X-coordinate in the scaled arena space.
- Y: shows the animal’s Y-coordinate in the scaled arena space.
- Z: shows the animal’s Z-coordinate or height value (if available from tracking).
- Time: shows the timestamp of the frame in the video or data stream.
- FromStart: shows the elapsed time (in seconds) from the beginning of the trial, displayed with millisecond precision.
Summary Result: displays comprehensive activity metrics for each area, such as how often the animal entered, how long it remained, and how far it moved within that space.
- TrialID: Displays the unique identification number of the trial in which the data was collected.
- Area: Indicates the specific region or zone within the arena being analyzed.
- EnterCnt: Shows how many times the animal entered the area.
- DurSec: Displays the total amount of time (in seconds) the animal stayed in that area.
- DurPct: Shows the percentage of the entire trial duration that the animal spent in that area.
- DistancePix: Indicates the total distance traveled within the area, measured in pixels.
- DistanceCm: Indicates the total distance traveled within the area, converted to centimeters.
- Animal: Shows the name or ID of the animal associated with the trial.
Area Group: shows area drawing information. The data is not important for the user at this point.
5.3 Specific Protocol Result Tables
Each maze may have implementations of specific protocols, and the results are described in the maze protocol section.
6. Common Behavior Measurements
6.1 Temporal Move Measurement
The Behavior Measure tab provides calculations of animal motor measurements.
It allows calculation of any number of results (multiple results), trials (multiple trials) or units (open field set of 4 has 4 units).
Charting provides drawing of the measurements (single trial or cross trial comparison).
6.2 Rotation Measurement
6.2.1 Rotation Episodes
Select a result and go to Behavior Measure tab
Select Rotation tab and time period
Press the Calc button , the rotation result is shown on the grid
The grid above indicates that there are two clockwise rotations and one counterclockwise rotation from 0 to 300 second period. RefSeq0 and RefSeq1 indicate the data points in the Track Data grid.
The AbsAngle is the cumulative absolute angular change in degree from frame to frame. Since AI based tracking software can handle more frames in a second, the value is larger than traditional tracking software as it is a summation of the absolute angular changes.
6.2.2 Algorithm for Rotation Calculation
The rotation in our calculation is a full rotation of 360°.
The animal body is taken as a center point and connects to the head point to create a position vector. Then the vector is normalized to start at the origin.
Analyze the change in position vector to identify the completion of a 360° rotation either clockwise or counterclockwise.
Both clockwise rotation and one counterclockwise rotation are calculated.
For example, the animal vector starts in quadrant 1 at 50°. To make a complete CW rotation, the animal must pass through quadrants 2, 3 and 4 and into quadrant 1. When the animal passes through 50° in quadrant 1, a CW rotation is completed.
Similarly, the animal must pass through quadrants 4, 3, 2 and into quadrant 1 and pass through 50° in quadrant 1 to complete a CCW rotation.
6.2.3 Rotation Details
The rotation Details grid show the animal position data and position vector visualization.
The green drawing point is the body center point and the red drawing point is the head point. The vector starting at the origin is the normalized vector and the other vector is animal position on the maze.
When the user navigates the data row, the vector is displayed visually.
The (X, Y) are the animal head position in pixels and (Xc, Yc) are the animal body position in pixels. Angle and Angel360 are calculated using formula:
radians = Math.Atan2(Yv, Xv);
Angle = radians * (180 / Math.PI);
Angle360 = Angel >= 0 ? Angle : (360 + Angel);
Diff360 is the difference of Angle from frame to frame
By default, the Rotation Details grid is invisible. To enable it, go to Properties and select ViewRotationDetails.
6.3 Activity Measurement
6.3.1 Active and Inactive Episodes
Select a result and go to Behavior Measure tab
Select Active tab and time period
Press the Calc button , the rotation result is shown on the grid
Inactive Max Pixels/s: For every second, if the animal moves less than (or equal) the parameter, the animal is inactive in the second; if the animal moves more than the parameter, the animal is active in the second.
Episode Type: Active or Inactive. An animal is defined to be active if it is either mobile
Episode Num: the number of active or inactive episodes
Total Time: Total Seconds the animal is active or inactive
Longest Dur: Longest duration of the active / inactive episodes
Shortest Dur: Shortest duration of the active / inactive episodes
Longest Dist: Longest distance in pixels of animal move in an episode
Shortest Dist: Shortest distance in pixels of animal move in an episode
6.3.2 Algorithm for Active and Inactive Calculation
An animal is defined to be active if it is either mobile
An animal is inactivity is defined as a lack of movement. It is measured in time unit second. For every second, if the animal has a total pixel change (sum of all frames in the second) less than (or equal) the parameter (say 10 pixels/second above), the animal is inactive during the second period; otherwise, the animal is active during the second period.
From the start, a continuous inactive period is defined as an inactive episode and a continuous active period is defined as an active episode.
6.3.3 Active and Inactive Details
The Active Details grid shows the animal move frame by frame.
TimePoint: each time second
DistPixel: Animal move distance in pixels from frame to frame
CumDistPixel: Cumulative animal move distance in pixels during the second
State: indicate the active or inactive at the end of each second
By default, the Active Details grid is invisible. To enable it, go to Properties and select ViewActiveDetails.
6.4 Angle Measurement
6.4.1 Meander or Angular Velocity
Select a result and go to Behavior Measure tab
Select Angle tab and time period
Press the Calc button , the Angle result is shown on the grid
Type: Meander or Angular Velocity
Meander is the Absolute turn angle divided by the Distance travelled
Angular Velocity is the Absolute turn angle divided by time period in second
The angle details is in the Rotation Details
6.5 Heatmap
6.5.1 Animal Tracking Data Heat Map
Select a result and go to Behavior Measure tab
Select Heat Map tab
Press the Calc button , the Tracking Heat Map is visualized on the grid
Above is an example of Y-maze Heat Map.
6.5.2 Heat Map Calculation
This heat map shows the animal's movement in a maze using animal position X, Y. The value at each coordinate indicates how many times the animal has been observed at that location. These counts are converted into percentages by comparing each point's count to the data size. This percentage then determines the color of each point: 0% activity is mapped to dark blue (low activity), and 100% activity is mapped to dark red (high activity). Thus, cooler colors (e.g., blue) indicate low activity, while warmer colors (e.g., red) represent higher activity levels.
6.5.3 Heat Map Image Export
The heat map image can be exported to a high-resolution image file.
7. Other Common Functionalities
7.1 Animal
The tab provides a place for users to enter animal information. The animal information then is applied to the results.
7.2. Export Data
- Select a result
- Click the Export button
- The output file format is .csv
7.2.1 Example Csv File
Job Execution Summary
Description: shows the overall status of a job, including its identification, name, result, execution status, and start and completion times.
Fields:
- JobId: the unique identifier of the job.
- JobName: the name of the job executed.
- ResultId: the identifier for the generated result.
- ResultName: the name or label of the result.
- RunStatus: indicates whether the job completed successfully, failed, or was stopped by the user.
- StartTime: the timestamp when the job began.
- CompleteTime: the timestamp when the job finished.
Area Summary
Description: shows summarized statistics for each area of the arena, including the number of entries, duration, jumps, and distances covered by the animal.
Fields:
- TrialId: the unique identifier of the trial.
- GridId (Area): the specific area of the arena.
- EnterCnt: number of times the animal entered the area.
- DurSec: total duration in seconds spent in the area.
- DurPct: percentage of total trial duration spent in the area.
- JumpCnt: number of jumps recorded in the area. (Note: may not be applicable for all mazes.)
- DistancePixel: total distance traveled within the area, measured in pixels.
- DistanceCm: total distance traveled within the area, converted to centimeters.
- AnimalName: name or identifier of the animal.
- UnitId: identifier of the measurement unit or tracking device (if applicable).
Tracking Data
Description: displays detailed frame-by-frame tracking of the animal during the trial, including position coordinates, timestamps, and other tracking metrics.
Fields:
- TrialId: the identifier of the trial.
- SeqId: sequential index of the recorded frame or action.
- GridId: arena area where the animal is located at the frame.
- Time: timestamp of the frame.
- FromStartSec: elapsed time from the start of the trial (in seconds).
- FrameCount: index of the frame in the video or data stream.
- UnitId: identifier for the tracking unit or sensor.
- ScaledXHead, ScaledYHead, ScaledZHead: X, Y, Z coordinates of the animal’s head in scaled arena space.
- ScaledXBody, ScaledYBody, ScaledZBody: X, Y, Z coordinates of the animal’s body.
- ScaledXDisplay, ScaledYDisplay, ScaledZDisplay: X, Y, Z coordinates used for display or visualization.
- ScaledRearPointLow, ScaledRearPointHigh: coordinates for the rear point of the animal (low and high). (Note: may not be applicable for all mazes.)
- IsOutlier: indicates whether the frame is marked as an outlier.
- CageId: identifier of the cage or arena.
- TimeUnadjusted: original timestamp before FPS adjustments.
- FromStartSecUnadjusted: original elapsed time before FPS adjustments.
Note: Some fields may not apply to every maze, but the general structure and meaning are consistent across experiments. Additionally, extra protocol-specific data will be exported if a specialized protocol is used for the maze. For example:
- Thigmotaxis in the Open Field maze
- Spontaneous alternation in the Y Maze
- Spontaneous alternation in the R Maze
These extra data fields provide additional measurements relevant to the specific behavioral protocol being applied.
7.3. Troubleshooting
7.3.1 Log display
- The log content can be displayed on the screen.
7.3.2 Database files and user data
The database file contains the protocols and results. There is a separate folder containing database files and video data for each maze under the bin folder.
7.4. ---
Demo version: the demo version is valid for one month from the download and no --- is required.
bin and override the old --- file.
For us to generate a ---, you will need to provide us with two machine names where Conduct Vision software is intended to run.
There are two ways to find the computer name.
Method 1: From Control Panel. It works for Windows 10 and Windows 11
Method 2: for Windows 11, from Start button -> System -> About
7.5. Camera Setup
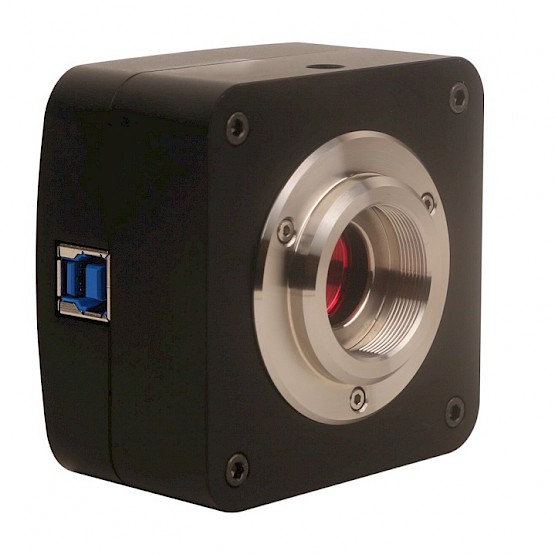
if one of our provided cameras is used, no drivers or software is required for the camera to function.
-
Disable any other cameras on the computer under “Device Manager”
-
Plug the camera into the computer's USB port. You should hear a noise to indicate the computer has recognized the camera.
-
Open the computer's camera app to confirm the camera's connection and adjust the camera’s view.
-
Either record subject trials in advance using your computer's camera app or Open the ConductVision app for live streaming.
8. Y-Maze Protocol
8.1 Y-Maze Spontaneous Alternation
The Y-maze spontaneous alternation test is a behavioral test often used in research, particularly in neuroscience and psychology, to assess spatial memory and exploratory behavior in rodents.
The Conduct Vision software provides spontaneous alternation analysis using tracking data.
8.1.1 Y-Maze Alternation Specification
- There are six possible sequences for Y-maze:
Y1 Y2 Y3
Y1 Y3 Y2
Y2 Y1 Y3
Y2 Y3 Y1
Y3 Y1 Y2
Y3 Y2 Y1
- The use can specify all sequences or a subset of the sequences. The screenshot below shows alternation sequences that are chosen.
- Once the specification is chosen and the Calculate button is clicked, the specification and the result is automatically saved.
8.1.2 Y-Maze Alternation Result
-
On the result tab, the Spontaneous Alternation panel displays the result of alternation analysis for the chosen specification.
-
Press button the calculation button , the alternation result is calculated and saved automatically.
-
The calucation is done for each trial. At the end of the result of the trial, a summary line is displayed with number of alternations and the alternation percentage.
-
Examples
- Example 1: the first four rows shows arm entry sequence Y1Y2Y3. Since Y1Y2Y3 is in the definition, the sequence makes an alternation.
-
- Example 2: the following four rows shows arm entry sequence Y3Y2Y1. Since Y3Y2Y1 is in the definition, the sequence makes an alternation.
-
- Example 2: the following four rows shows arm entry sequence Y2Y3Y2. Since Y2Y3Y2 goes back to Y2 after Y2Y3, it is not a spontaneous alternation.
-
Total alternations
The last row of the entries for a trial shows the total alternations and alternation percentage
8.1.3 Y-Maze Alternation Calculation and Interpretation
- Alternation Percentage
= x 100
- A high spontaneous alternation percentage indicates good working memory and spatial awareness, whereas a lower percentage may suggest memory impairment or cognitive deficits. This measure is especially useful in studies on neurodegenerative disease, pharmacological interventions, and genetic modifications affecting memory and cognition.
For further detail, search ChatGPT message “Y-maze spontaneous alternation percentage”
8.1.4 Y-maze Reentry Calculation
Definition: Arm reentry includes Immediate Reentry and 2-Step Reentry:
- Immediate Reentry - Reentering the same arm immediately after leaving it (e.g., A → A)
- 2-Step Reentry - The animal enters the same arm within 3 consecutive choices. Every time an arm repeats within the 3-entry sequence (e.g., A → B → A)
For example, given the following sequence:
{"A", "S", "B", "S", "A", "S", "C", "S", "A", "S", "C", "S", "B", "S", "B"}
Where:
"S" = center,
"A", "B", "C" = maze arms (actual entries of interest).
Calculation Example:
The center is excluded from arm transition analysis.
8.1.5 Result Verification
The software provides detailed information about each arm entry or reentry. The entries and reentries are easily verified with video replay.
8.2 Video Batch Processing
Mouse tracking video batch processing involves analyzing multiple videos to extract mouse behavior measurements, which are often used in behavioral studies.
Organize your video files in folders with a clear naming convention. During the recording of multiple animals, the camera and maze should be positioned steadily. Make sure that each arm drawing covers the arm properly for all videos.
8.2.1 Batch Track Params
To enable the batch processing, create a protocol, select RunBatch, TrialDur(s), and Track Part on the Track Params panel and then go to Batch tab. Also, make sure to set the number of trials to match the number of videos for batch processing.
8.2.3 Batch Videos
On Batch tab panel, the batch videos are loaded, and the animal names are entered
- loads multiple videos from a folder and places the selected video files in the table
deletes table contents
- saves the table contents to the protocol. Make sure the table contents are saved before running the tracking
- reloads saved table contents
displays the thumbnail of the selected video on the table. Navigate all videos to Make sure that each arm drawing covers the arm properly for all videos.
In the table, each video is assigned a trial ID. So the batch processing is essentially running multiple trials, each trial with a video in the row.
8.2.3 Video Batch Processing Results
The results are in the Result tab. The Summary Result panel displays the mouse movement measurements per trial, therefore per animal.
Spontaneous Alternation panel displays the result per trial therefore per animal.
The results can be downloaded for easy comparison.
8.2.4 Key Steps
The key steps are summarized:
- Create a protocol, select RunBatch and other parameters
- Load video files and input animal names
- Run video tracking like individual video file or live tracking
- The result is in the result table like the individual video file or live tracking
8.3 Arm Entry Double Lines
8.3.1 Arm Entry Detection
A mouse might cross the zone, pause or turn around briefly, and re-enter — looks like a “double entry.”
We introduce a double line logic to interpret and handle it:
- Two parallel lines to from a small buffer entry area
- Only count an entry if the animal fully enters past both lines
- The two parallel lines drawing and interpretation is in the Result tab after the tracking is completed so that the user can modify the lines distance and calculate the results.
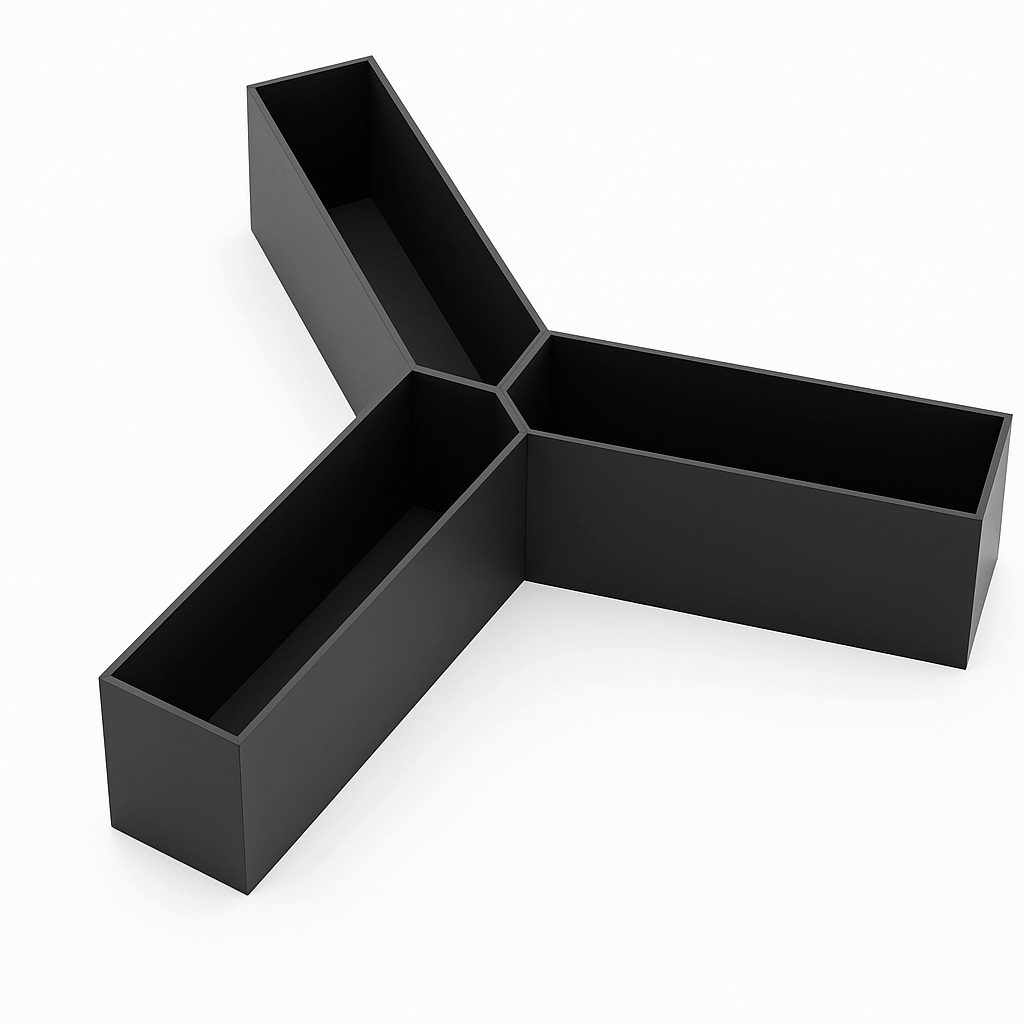
Using Y-maze as an example, given a Y-maze arm drawing (three arms and a center area**, picture 1**) and a parameter YmazeEnterPixel = 30, is used, each arm automatically generates a double line area with 30 pixels between two lines (picture 2).
AI-generated content may be incorrect." src=""> Picture 1 | <img alt="A blue object with red lines AI-generated content may be incorrect." src="">Picture 2 |
8.3.2 From Center to Arm
An animal is considered from the center to an arm if the animal starts from the center, passes through the entry area (yellow area) and enters the inner arm area.
If the animal starts from the center, goes to entry area (yellow area) but never touches inner arm, it is considered still in the center
The animal is in the inner arm area if it is in the drawing arm but not in the entry area (yellow area)
Center 🡺 entry area (yellow area) 🡺 inner arm
8.3.3 From Arm to Center
An animal is considered from an arm to the center if the animal starts from the inner arm area, passes through the entry area (yellow area) and enters the center area.
Inner arm 🡺 entry area (yellow area) 🡺 center
8.3.4 Line Distance Parameter
The entry area distance parameter can be set from the Property button
AI-generated content may be incorrect." src=""> | <img alt="A screenshot of a computer AI-generated content may be incorrect." src=""> |
9. Radial Arm Maze Protocol
9.1 Radial Arm Maze Alternation Protocol
The Radial Arm maze spontaneous alternation test is a behavioral test often used in research, particularly in neuroscience and psychology, to assess spatial memory and exploratory behavior in rodents.
The Conduct Vision software provides spontaneous alternation analysis using tracking data.
9.1.1 Radial Arm Maze Alternation Specification
- Add Areas to the Sequence:
- Select an area from the dropdown menu.
- Click the Add to Sequence button to include it in the sequence.
- Note: Duplicate areas cannot be added to the sequence.
- Randomize the Sequence:
- Click the Randomize button to shuffle the order of the sequence.
- Ignore Sequence Order:
- Uncheck the Ignore Order parameter to maintain the specified order of the sequence.
- Add a Definition:
- Provide a name for the definition.
- Choose a set of sequences.
- Click the Add button to save the definition.
- Remove a Definition:
- Select the corresponding row in the grid.
- Click the Remove button to delete the definition.
- Save the Specification:
- Click the Save button to save the current specification.
- Once saved, the specification will appear on the Result tab after a trial run is completed.
9.1.2 Radial Arm Maze Alternation Result
-
On the result tab, the Spontaneous Alternation panel displays the result of alternation analysis.
-
Choose the alternation specification name and the specification definition is displayed in the next field.
-
Press button the calculation button , the alternation result is calculated and saved automatically.
-
The calucation is done for each trial. At the end of the result of the trial, a summary line is displayed with number of alternations and the alternation percentage.
-
Examples
- Example 1: the first four rows shows arm entry sequence R1 R8 R7. Since R1 R8 R7 is in the definition, the sequence makes an alternation.
-
- Example 2: the following four rows shows arm entry sequence R1 R8 R7. Since R8 R7 R1 is in the definition and IgnoreOrder is checked, the sequence makes an alternation.
-
Total alternations
The last row of the entries for a trial shows the total alternations and alternation percentage
9.1.3 Radial Arm Maze Alternation Calculation and Interpretation
- Alternation Percentage
= x 100
- A high spontaneous alternation percentage indicates good working memory and spatial awareness, whereas a lower percentage may suggest memory impairment or cognitive deficits. This measure is especially useful in studies on neurodegenerative disease, pharmacological interventions, and genetic modifications affecting memory and cognition.
For further detail, search ChatGPT message “Radial Arm maze spontaneous alternation percentage”
9.2 Radial Arm Entry Double Lines
Radial Arm double line entry and exit logic is like Y-maze. Please see the relevant section in Y-maze protocol.
9.3 Automated Radial Arm
9.3.1 Automated Radial Arm Maze Hardware
Automated Radial Arm Maze has automation components:
- Auto doors
- Pellet dispensers or lick-o-meters
- TTL
- The sensor detection of animal entering or exiting an arm can be done with sensors or this ConductVision video tracking
If you need more information about the hardware, please request the hardware manual from ConductVision support
With ConductVision, the software detects the animal entering or exiting an arm and issue commands to control the hardware. The protocol setup is on ConductVision.
The spontaneous alternation analysis and double line logic are applicable just like regular Radia Arm maze.
For automated Radial Maze, we often call it Rmaze in the documentation
9.3.1 Enable Automation
To enable automation for the radial arm maze, go to Property and select Automated Radial Maze.
9.3.2 Rmaze Parameters
For automation, an additional tab Maze Protocol is added. The tab has multiple sections
Param Section:
- Initial delay – the session will wait for the initial delay time period in seconds
- ITI – Inter Trial Intervale in seconds between trials
Trial Complete Condition
- When a trial meets the condition, the trial will end and proceed to the next trial
- In the video tracking protocol, there is a total trial time. Make sure the total trial time is long enough to cover the trial session.
Event Action Configuration
- The panel allows the user to configure the event-action-condition
- The events include door entering and exiting, start of trial and end of trial
- The actions include reward delivery and play tone
9.3.3 Maze Controller
In the Maze Protocol panel, the user can view, edit and test Protocol Actions.
- The button is used to load the MazeController from the ConductAdapterUI bin folder. The executable is used to send commands to ConductAdapterUI to control the hardware.
The text field displays the executable file path.
- The button is used to send commands to ConductAdapterUI for manual testing.
9.3.4 Rmaze Execution Results
In the Radial Arm Result tab, additional panels Rmaze Activity and Animal Visit are added.
Rmaze Activity panel contains details of the interaction between video tracking and the hardware
Animal Visit panel contains the required arm visit conditions and the real-time animal visits
Replay Details panel displays animal location each frame in real time with double line logic applied. In the regular radial arm maze, this table is populated after the tracking session.
9.4 Rmaze Conduct Adapter
ConductVision
ConductAdapterUI
2. Commands
1. Connect
2.1. Commands
Experiment Automation Sequence
9.4.1 Conduct Adapter Software
-
Maze Engineers software ConductAdapterUI is a light-weight adapter for ConductVision to control the execution of Radial Arm maze hardware
-
The software adapter comes with ConductVision. The default folder is
-
The executable ConductAdapterUI is in the folder
It is a light-weight Windows UI application that needs to start before experiments. The application accepts commands from ConductVision and controls the execution of the commands.
9.4.2 Start ConductAdapterUI
When the micro-controller is connected to your computer, a port is created as shown on the Device Manager:
If the device is not shown on the Ports section, it will appear in different sections. This is because the computer could not find the driver for the hardware device. In this case, you will need to install the driver (small disc in the box of UNITEK) which is included in shipping. A digital version of the USB driver is included in shipment so that you would not need a CD reader.
For Windows11, the driver install appears to be unnecessary.
Double click on ConductAdapterUI, the main window appears as below:
9.4.3 ConductAdapterUI Permission
When ConductAdapterUI is downloaded from web, sometimes the local computer alters the permission of ConductAdapterUI. If you encounter any issue sending commands from ConductVision to ConductAdapterUI. Right click on ConductAdapterUI and enable the permissions.
10. T-maze Protocol
10.1 T-maze Alternation Protocol
10.1.1 T-maze Spontaneous Alternation
10.1.2 T-maze Forced Choice
11. Open Field and Open Field4 Protocol
11.1 Open Field & Open Field4 Thigmotaxis Measurement
11.1.1 Arena Setup
- The Maze Engineers open field maze has a dimension of 40 x 40 cm for mice and 60x60 cm for rats. We use open field of 40 cm × 40 cm as example.
- Center and periphery (wall zone) are virtually divided. If you set up the number of grids as 8x8, each grid has a dimension of 5 x 5 cm.
- Center region: typically, the inner 25% or 50% of the arena.
- Periphery region: outer area near walls.
11.1.2 Key Behavioral Metrics:
Time spent in periphery vs. center (higher periphery time = more anxiety).
Distance traveled in periphery vs. center.
Entries into the center (fewer entries = more anxiety).
Velocity & movement patterns.
11.1.3. Summary Result
-
You can get the Behavioral Metrics from the Summary Result for each grid.
-
Aggregate the grid metrics into region metrics.
-
The results can be highlighted using Ctrl+A, then Ctrl+C / Ctrl+P to copy / past to a spreadsheet for aggregation.
-
The enhancement for users to define the region and calculation will be in the next release.
-
The Thigmotaxis region is the outermost border by default, with the rest as the Center region. To customize, define the region in the Thigmotaxis Params section and click Calculate to update the data.
11.2 Open Field Rearing Behavior Analysis
11.2.1 Rearing Protocol Setup
-
In the Open Field Protocol panel, the rearing analysis is disabled by default. To enable rearing analysis, go to Properties and select UseRear.
-
Load the side view video and draw rectangles marking the maze's front and back faces on the preview frame. These rectangles help to calculate perspective scaling parameters - it normalizes animal size across different depths, eliminating perspective distortion (where closer objects appear larger and distant objects appear smaller).
scalingFactor = 1 + (frontToBackRatio - 1) * normalizedPosition
normalizedPosition is calculated from the top-down view's Y-coordinate
Example:
If frontToBackRatio = 2 (front is 2× taller than back):
At front (normalizedPosition = 0): scalingFactor = 1 (no adjustment).
At back (normalizedPosition = 1): scalingFactor = 2 (object is scaled up to match front size).
In between: Linear interpolation (e.g., halfway → scalingFactor = 1.5).
11.2.2 Result Analysis
- In the result panel, click the Rearing Analysis tab on the right. Click the Calculate button to load the rearing details. A horizontal bar will appear in the threshold preview section. Rearing data that exceeds the threshold will be loaded into the rearing details table, and a corresponding chart will be generated based on the given time interval.
- The user can visualize rearing behavior frame by frame by replaying the video or jumping to a specific frame using the frame ID. This also helps in setting the threshold to filter out non-rearing data.
11.3 Video Batch Processing
Mouse tracking video batch processing involves analyzing multiple videos to extract mouse behavior measurements, which are often used in behavioral studies.
Organize your video files in folders with a clear naming convention. During the recording of multiple animals, the camera and maze should be positioned steadily. Make sure that each arm drawing covers the arm properly for all videos.
11.3.1 Batch Track Params
To enable the batch processing, create a protocol, select RunBatch, TrialDur(s), and Track Part on the Track Params panel and then go to Batch tab. Also, make sure to set the number of trials to match the number of videos for batch processing.
8.2.3 Batch Videos
On Batch tab panel, the batch videos are loaded, and the animal names are entered
- loads multiple videos from a folder and places the selected video files in the table
deletes table contents
- saves the table contents to the protocol. Make sure the table contents are saved before running the tracking
- reloads saved table contents
displays the thumbnail of the selected video on the table. Navigate all videos to Make sure that each arm drawing covers the arm properly for all videos.
In the table, each video is assigned a trial ID. So the batch processing is essentially running multiple trials, each trial with a video in the row.
11.2.3 Video Batch Processing Results
The results are in the Result tab. The Summary Result panel displays the mouse movement measurements per trial, therefore per animal.
The thigmotaxis summary will be displayed per trial, and therefore per animal.
The results can be downloaded for easy comparison.
11.2.4 Key Steps
The key steps are summarized:
- Create a protocol, select RunBatch and other parameters
- Load video files and input animal names
- Run video tracking like individual video file or live tracking
- The result is in the result table like the individual video file or live tracking
12. Novel Object and Novel Object 4 Protocol
12.1 Novel Object Area Drawing
12.1.1 Drawing Shapes
For a novel object maze, the components include a maze, a novel object and a known object.
The shape of the Maze is a rectangle.
The novel object and known object’s shape can be a polygon, oval or rectangle
12.1.2 Draw Oval and Rectangle
To draw Oval or Rectangle shape, choose a component (maze, known, novel) and click the Draw button
On the maze, choose a starting point, drag the mouse and release the mouse at the end point
12.1.3 Draw Polygon
To draw Polygon for known or novel objects, choose the known object or novel object, and click on Draw button.
Choose a start point and select the points along the object border. When the end point is close to the start point, the blue circle appears. Click on the blue circle to complete a polygon. The complete the drawing before its completion, the user can click on the right mouse.
12.1.4 Move Polygon
To move the polygon for known or novel object, choose the object and click on the Move button.
Left mouse down on the polygon and drag it to the target location and release the mouse. When mouse is in the moving mode, the polygon border color changes to light golden.
12.1.5 Edit Polygon
To edit the polygon for the known or novel object, choose the object and click on the Edit button to enter the edit mode.
Place left mouse over a polygon vertex and observe the vertex color turning to blue. Drag the vertex to a target location and release the mouse.
The edit can continue to different vertexes. To end Edit mode, right-click on the maze or press the Edit button to end the edit mode.
12.2 Novel Object & Novel Object 4 Exploration Protocol
12.1.1 Novel Object Exploration Protocol Setup
In the result panel, the animal’s exploration behavior can be further analyzed by refining the threshold distance, the head angle towards the object, and the duration it remains within the threshold angle while facing the object.
12.2.2 Exploration result analysis
After clicking the Calculate button, the detailed results of each episode will be displayed in the table. The green row represents the total summary, where the total novel object exploration count, known object count, and total duration are calculated.
12.2 Video Batch Processing
Mouse tracking video batch processing involves analyzing multiple videos to extract mouse behavior measurements, which are often used in behavioral studies.
Organize your video files in folders with a clear naming convention. During the recording of multiple animals, the camera and maze should be positioned steadily. Make sure that each arm drawing covers the arm properly for all videos.
12.2.1 Batch Track Params
To enable the batch processing, create a protocol, select RunBatch, TrialDur(s), and Track Part on the Track Params panel and then go to Batch tab. Also, make sure to set the number of trials to match the number of videos for batch processing.
12.2.3 Batch Videos
On Batch tab panel, the batch videos are loaded, and the animal names are entered
- loads multiple videos from a folder and places the selected video files in the table
deletes table contents
- saves the table contents to the protocol. Make sure the table contents are saved before running the tracking
- reloads saved table contents
displays the thumbnail of the selected video on the table. Navigate all videos to Make sure that each arm drawing covers the arm properly for all videos.
In the table, each video is assigned a trial ID. So the batch processing is essentially running multiple trials, each trial with a video in the row.
12.2.3 Video Batch Processing Results
The results are in the Result tab. The Summary Result panel displays the mouse movement measurements per trial, therefore per animal.
Explore panel displays the result per trial.
The results can be downloaded for easy comparison.
12.2.4 Key Steps
The key steps are summarized:
- Create a protocol, select RunBatch and other parameters
- Load video files and input animal names
- Run video tracking like individual video file or live tracking
- The result is in the result table like the individual video file or live tracking
13. Elevated Plus Maze Protocol
13.1 Elevated Plus Maze Head Dip Analysis
In the Elevated Plus Maze (EPM), a head-dip is when the rodent leans over the edge of an open arm and dips its head downwards toward the floor. Sometimes categorized as protected (from closed arm/covered area) vs unprotected (from open arm).
13.1.1 Head Dip Region
Head dip regions are drawn automatically once all arms are defined. The default distance between the head-dip region and the arm region is 15 pixels, but this value can be adjusted in the results. Ideally, the regions should be drawn without overlapping.
13.1.2 Protocol Setup
The user can define the minimum duration for user-defined episodes. This means that a continuous head dip longer than this minimum duration will be counted as one head dip. The head-dip distance refers to the outer region of the open arm. The default and maximum value is 15 pixels. The user can make the area smaller, but this is usually not necessary.
13.1.3 Head Dip Result Table
For the head dip result, the analysis can be calculated by pressing the Calc button. The total protected and unprotected head-dip durations and counts will be highlighted in a green row.
14. Barnes Maze Protocol
14.1 Barnes Maze Zone Analysis
14.1.1 Barnes Maze Zones
The zone drawing and analysis are on the Result Tab. To show the zone quadrants,
Choose the Target Hole name and enable Show Zones and then click on button Calc Zone.
The 20 holes are named H1, H2, …, H20. They need to be in sequence in the protocol drawing for the automated zone drawing.
Note that the target hole is not required to be specified in the protocol and running tracking.
Define zones:
- Target quadrant (TQ): the 90° sector centered on the target hole
- Opposite quadrant (OQ): the opposite quadrant from the target.
- Positive and negative quadrants: the two neighboring quadrants to the target.
14.1.2 Barnes Maze Zone Entry Details
Use animal body center for each frame to compute if the animal is inside a quadrant. The result is displayed in the column Zone in Activity table
The zone entry episodes are in the Zone Detail table. To avoid micro-crossing, Min Enter Dur(s) parameter is used to ensure the continuous presence in the zone for the specified duration.
14.1.3 Barnes Maze Zone Entry Logic
Case 1: Assume that Min Enter Dur(s) =0.4. Animal enters Target from Positive and then backs out to Positive.
In the seq Id=6, the animal enters Target for a duration of 0.33 < 0.4. So this entry line 6 is combined to line 5. Since the line 7 is also in Zone Positive as line 5, line 7 is combined to line 5
Case 2: Assume that Min Enter Dur(s) =0.4. Animal enters Target from Positive and then enters Negative.
In the seq Id=6, the animal enters Target for a duration of 0.33 < 0.4. But the animal is not back to Positive. So line 6 is a valid entry.
14.1.4 Barnes Maze Zone Summary
The Summary result is in the Zone Summary tab. The table contains the fields:
- Time in quadrants: % time in each quadrant (chance = 25%).
- Visits: entries into TQ vs. others
- Latency to first TQ entry and first target hole visit.
- Search bias score: Bias = %TQ − mean (other quadrants)
- Spatial selectivity index: Index= (%TQ−%OQ) / (%TQ+%OQ) between [−1,1]
15. Zero Maze Protocol
15.1 Zero Maze Head Dip Analysis
In the Zero Maze a head-dip is when the rodent leans over the edge of an open arm and dips its head downwards toward the floor. Sometimes categorized as protected (from closed area/covered area) vs unprotected (from open area).
15.1.1 Head Dip Region
Users need to define and draw the inner arc for the open region. This area is required by the software to accurately determine whether the mouse is located within the precise boundaries of the open region during analysis.
15.1.2 Protocol Setup
Users can define the minimum duration for user-defined head-dip episodes. A continuous head-dip that lasts longer than this specified duration will be recorded as a single head-dip event.
The open region pixel distance refers to the space between the outer arc and the inner arc of the open arm region. Users can adjust this distance to achieve the most accurate fit for their specific maze setup and video resolution.
15.1.3 Head Dip Result Table
For the head dip results, the analysis can be performed by pressing the Calc button. The software will calculate and display the total duration and count of both protected and unprotected head-dips, which will be highlighted in a green row within the results table. Users can also select a specific row and click the Replay button located above the table to view the corresponding head dip video clip for that entry.
16. Light Dark Maze Protocol
17. Water Maze Protocol
17.2 Video Batch Processing
Mouse tracking video batch processing involves analyzing multiple videos to extract mouse behavior measurements, which are often used in behavioral studies.
Organize your video files in folders with a clear naming convention. During the recording of multiple animals, the camera and maze should be positioned steadily. Make sure that each arm drawing covers the arm properly for all videos.
17.2.1 Batch Track Params
To enable the batch processing, create a protocol, select RunBatch, TrialDur(s), and Track Part on the Track Params panel and then go to Batch tab. Also, make sure to set the number of trials to match the number of videos for batch processing.
17.2.3 Batch Videos
On Batch tab panel, the batch videos are loaded, and the animal names are entered
- loads multiple videos from a folder and places the selected video files in the table
deletes table contents
- saves the table contents to the protocol. Make sure the table contents are saved before running the tracking
- reloads saved table contents
displays the thumbnail of the selected video on the table. Navigate all videos to Make sure that each arm drawing covers the arm properly for all videos.
In the table, each video is assigned a trial ID. So the batch processing is essentially running multiple trials, each trial with a video in the row.
17.2.3 Video Batch Processing Results
The results are in the Result tab. The Summary Result panel displays the mouse movement measurements per trial, therefore per animal.
The results can be downloaded for easy comparison.
17.2.4 Key Steps
The key steps are summarized:
- Create a protocol, select RunBatch and other parameters
- Load video files and input animal names
- Run video tracking like individual video file or live tracking
- The result is in the result table like the individual video file or live tracking
18. Sociability Maze Protocol
19. Open Field Grooming Protocol
19.1 Grooming in Open Field
- The open field test usually measures locomotion, exploration, anxiety-like behavior (time in center vs periphery).
- Grooming episodes (face washing, body licking, paw licking, etc.) are often scored as an additional behavioral readout.
- Grooming can be interpreted as:
- Normal stress-coping (short bouts).
- Excessive or fragmented grooming (linked to anxiety, OCD-like phenotypes, dopaminergic imbalance, or stress-induced behaviors).
- Grooming has characteristics of forepaw movements near the face/head, reduced locomotion, and repetitive motion pattern.
19.2 ConductVision Machine Learning Technologies
- Grooming is difficult for traditional video tracking software such as EthoVision to detect directly
- ConductVision utilizes the AI and machine learning technologies to automatically detect the grooming episodes
- ConductVision track key points (nose, forepaws, body center and other parts), calculate paw-to-head distance and paw movement speed (fast oscillations while head position is relatively stable) and combine these features into a machine learning classifier
- Analyzing Rodent grooming behavior from a bottom-up camera view
19.3 Why Bottom-Up Helps
- Forepaws and nose are visible against the transparent floor
- You can track fine paw movements without the body blocking the view
- It is easier to distinguish between locomotion (clear paw stepping) and grooming (rapid paw oscillations near the head).
19.4 Open Field Grooming Protocol Setup
The protocol setup is like open field test. Once a video file is selected, the video duration, fps, camera resolution and video are automatically populated.
19.5 Open Field Grooming Results
- After running the protocol, double click on the result on the Experiment Results on the left.
- The results are on the tab OpenGroomingResult
19.5.1 Tracking Details and Replay
- The tracking details are on the table Replay Details. The column Grooming is the grooming indicator of the frames
- The video can replay with tracking row highlighted
- A certain frame can be searched and then play frame by frame manually
19.5.2 Grooming Episodes
Grooming detection and episodes
- Convert classifier output to binary grooming = 0/1 in the Tracking Details table
- Choose Min Dur(s) (minimum grooming duration like 0.2 seconds in the screenshot above) to identify the grooming episodes
- CM to Pixel is the pixels per cm based on rule measurement on the protocol configuration. It is readonly.
- are action buttons - The first button populated the episode tables Grooming Episodes and Grooming Summary - The second button saves the episode results - The third button plays episode video clips. Choose the episode row and then click the button
- Measured parameters include:
- Latency to first grooming
- Number of grooming episodes
- Each and total grooming duration
- Each and total distance traveled
19.5.3 Grooming Heatmap
This heat map shows the location of the occurrences of the grooming in a maze using animal position X, Y (head). The value at each coordinate indicates how many times the animal has been observed at that location. These counts are converted into percentages by comparing each point's count to the data size. This percentage then determines the color of each point: 0% activity is mapped to dark blue (low activity), and 100% activity is mapped to dark red (high activity). Thus, cooler colors (e.g., blue) indicate low activity, while warmer colors (e.g., red) represent higher activity levels.
The heat map image can be exported to a high-resolution image file by clicking the export button .
19.5.4 Grooming Patterns
- ConductVision provides a default grooming pattern model of “grooming or non-grooming”.
- ConductVision Annotator software (separate software) lets users define grooming patterns for ConductVision to detect those behaviors. This allows for automatically distinguishing grooming phases (e.g., face strokes vs body licking) in quantifying pattern structure in the Open Field grooming test
20. Open Field Gait Analysis
20.1 Gait Analysis in Open Field
Gait analysis extends traditional OFT by measuring step patterns, stride cycles, paw coordination, and interlimb phase relationships instead of just general movement or anxiety measures (e.g., center vs periphery).
Gait analysis includes parameters like:
- Stride length
- Paw placement
- Stance vs. swing phase
- Interlimb coordination
- Gait symmetry
- Base of support
20.2 ConductVision AI and Machine Learning Technologies
- ConductVision utilizes the AI and unsupervised Hidden Markov Model (HMM) to classify paw movement states of stance and swing. This probabilistic modeling enabled smooth temporal segmentation of paw activity and accurate identification of stride cycles in mouse gait, providing a data-driven, label-free approach to behavioral state prediction.
- ConductVision tracks key points (nose, forepaws, hind paws, body center and other parts), calculates spatial distance and paw movement and combines these features into the HMM model to calculate the parameter values.
- Analyzing gait behavior from a bottom-up camera view
20.3 Why Bottom-Up Helps
- Forepaws and nose are visible against the transparent floor
- You can track fine paw movements without the body blocking the view
20.4 Open Field Gait Protocol Setup
- The protocol setup is like open field test. The number of trials is set to 1 and trial duration needs to be entered.
- Once a video file is selected, the video duration, fps, camera resolution and video are automatically populated.
- Before running the protocol, it is required to draw a maze rectangle and measure the ruler.
20.5 Open Field Gait Analysis Results
20.5.1 Tracking Details and Replay
- The tracking details are on the table Replay Details. The columns LF State, RF State, LH State, RH State are the indicator of the paw states. 0 represents stance and 1 represents swing.
- The video can replay with tracking row highlighted
- A certain frame can be searched and then play frame by frame manually
- Key points to be displayed can be configured in the Property
20.5.2 Paw Details
-
Generate button calculates and populates the data for the Paw Detail table, Stride Detail table and Gait Coordination table
-
Play button: select one of multiple consecutive rows and click button can play the video clips on the Replay panel
-
For each paw, the table calculates the parameter values of each stride phase (stance and swing):
- StartFrame – start frame of the phase
- EndFrame – end frame of the phase
- Travel Pixel – travel distance in pixels
- Travel Cm – travel distance in centimeter
- DurMs – phase duration in milliseconds
- BoS Pixel – Base of Support in pixels is the average distance between left and right paws centers from StartFrame to EndFrame. For example, the first row is for LeftForePaw with frame range [0, 5], then the BoS is the average distance of LeftForePaw and RightForePaw for the frame range [0, 5]
- BoS Cm – Base of Support in centimeter
- FromStart0 – the time from the start the phase starts
- FromStart1 – the time from the start the phase ends
- Stride ID – the stride id for the stance and swing
- Frames – the total frames for stance and swing phase
-
Pixels / Cm displays the pixel and cm ratio in the ruler measurements in the protocol setup
20.5.3 Gait Parameters
- The table shows the Stride Distance, Duration, Duty Cycle, Base of Support for each stride and each paw
- The StrideLength is the cumulative distance from frame to frame during the stride interval
- Duty Cycle is defined as
- Base of Support in pixels is the average distance between left and right paws centers from StartFrame to EndFrame.
- A button will make the table columns best fit
20.5.4 Gait Coordination
-
For each pair of paws, calculate the phase difference in degree
-
For each stride of paw A, the algorithm to find the nearest stride of B:
-
For each stride of paw A (defined by consecutive touchdown times Ai -> Ai+1
-
For stride interval [Ai, Ai+1], and we have corresponding timestamps TAi, and TAi+1
-
Find the first stance of paw Bj that occurs inside that interval [Ai, Ai+1]
- if found: phase difference = (TBj - TAi) / (TAi+1 – TAi) * 360°.
- if none found: we have choices (a) skip this stride, (b) use nearest B event (previous or next) and adjust modulo, or (c) record NaN. We choose skipping the stride.
-
Normalize result into [0,360].
-
Repeat for each stride i, we get a list of phase differences per stride.
-
StrideId1 is the strike index of the first paw A and the StrideId2 is the nearest stride index of B in the Gait Coordination grid. StartFrame1 and StartFrame2 are the first frame of stride1 and stride2. StrideFrame1 is the length of stride1.
20.5.5 Naming Convention
- OpenGait is the short name for the gait analysis on the open field.
- (LF, RF, LH, RH) are the short names for LeftForePaw, RightForePaw, LeftHindPaw, RightHindPaw throughout the gait analysis section.
20.6 Open Field Gait Analysis Visualization
The gait analysis visualizations are on the left top panel of OpenGait Result tab including
- Trajectory Chart - Paw/body movement path over time on using scatter line plot of (X,Y).
- Stride Detail Chart – display the parameters from the Stride Detail panel
- Paw Contact Chart – displays paw contacts for four paws
- Stride Cycle Chart – displays stride cycle for four paws
- Phase Difference Chart –
are the chart button to generate chart and export button to generate high-resolution image file.
Each is described in detail below.
20.6.1 Paw and Body Trajectory
- The Trajectory Chart shows the path traced by an animal’s movement over time. The position (x, y) represents the animal’s paws or body positions
- Data are from the panel Reply Detail panel
- Users can choose one or more body parts from (leftForePaw, RightForePaw, leftHindPaw, RightHindPaw, Body)
- Chart can optionally show the starting point
- The chart can be exported to a high-resolution image
20.6.2 Stride Detail Chart
- The Stride Detail Chart displays the parameters per stride from the Stride Detail panel. The X-axis represents stride id from 0.
- The data are from the Stride Detail panel. To generate the data, click the Generate button from on the right-side panel
- One or more paws can be selected from (leftForePaw, RightForePaw, leftHindPaw, RightHindPaw).
- One or more parameters can be selected from the list (StrideDurMs, DutyCyclePct, StrideLengthCm, BoSCm). Since each parameter represents a different measurement, it makes sense to choose only one parameter.
- The chart can be exported to a high-resolution image
20.6.3 Paw Contact Chart
- The Paw Contact Chart displays paw’s stance vs swing duration in frames. X-axis represents the frames
- The data are from the Paw Detail in the right- side panel
- The four bar charts represent the four paws
- LeftForePaw – Red color in the first row
- RightForePaw – Green color in the second row
- LeftHindPaw – Blue color in the third row
- RightHindPaw – Purple color in the last row
- Color bars represents the stance and the gap represents the swing
- The parameter Pixels / Frame is the drawing width on the canvas for visual purposes
- The chart can be exported to a high-resolution image
20.6.3 Stride Cycle Chart
- The Stride Cycle Chart displays a normalized stride cycle diagram
- A stride cycle is the complete movement pattern of a limb (paw) from one contact with the ground to the next contact of the same limb.
- A stride cycle duration = stance duration + swing duration
- X-axis represents the normalized stride interval
- Each bar represents the portion of time a paw in stance
- Data are from Paw Contact in the right-side panel
- The parameter Pixels/Stride shows the drawing width per stride. For example, 30 pixels/stride draws a stride interval with 30 pixels. The parameter can be adjusted to make stride interval drawing larger or smaller
- The chart can be exported to a high-resolution image
20.6.4 Phase Difference Chart
- The Phase Difference Chart displays the relative timing between two limbs (often left vs. right or fore vs. hind). It tells you how synchronized two paws are within the stride cycle.
- The data are from the Gait Coordination tab on the right-side panel
- The chart can be exported to a high-resolution image
- Interpretation of the chart
20.7 Open Field Gait Sub-Selected Data Group
20.7.1 Create Data Groups
When the result is ready, the software is able to scrub through the frames and create a data group with start frame and end frame. If no group is created, the entire data set is used for calculations and visualization.
is the slider to select a range of frames. It is enforced to have no overlaps of the frames in different data groups.
allows the user to enter a group name, add the group name to the group list, delete a selected group, play the group video clips, and save the group (new or modification)
The column Group displays the group name for the tracking frame rows.
20.7.2 Create Data Groups for Calculation and Visualization
For the gait analysis and visualization, a group and multiple groups can be used. If a group is used, it represents a subset of data frames. If multiple groups are selected, different chunks of data are concatenated, and gaps exist in the data visualization as a downside effect.
20.8 Fixing Bad Tracking Key Points
20.8.1 Fixing Bad Tracking Key Points
Bad tracking usually shows:
- Sudden jumps
- Impossible positions
- Low likelihood
This can be identified from the data and replay of the frame with key point visualization.
20.8.2 Editing Bad Tracking Key Points
To edit, click on the Edit button to enable the table columns in editing mode. The columns (Nose, Spine1, LeftForePaw, RightForePaw, LeftHindPaw, RightHindPaw) are editable as those columns are relevant in the gait analysis. Each animal part has three columns related to the key points, for example, (Nose Conf, NoseX, NoseY) for Nose.
To end the edit mode, click on the Edit button again. It is a good idea to change the likelihood columns to 1.1 (software ranges [0, 1]) to indicate the manual modification.
To save the editing, click on the Save button. The save action will end edit mode as well.
The table contains distance and speed calculation results for each frame. To update the calculations, reload the result tab after saving the manual editing.
20.8.3 Reversing Manual Key Point Corrections
To reverse the manual editing, the user can delete the data file in
bin\ _OpenGait\media\test_Res\test_Res_Final.csv
where test_Rest is the result name.
The reload the result, a new final file will be generated with manual modification.