Conduct Vision Fish Software Manual
Contents
- Install and Run Application
- Maze Types
- Video Service Connection
- Experiment Configuration
- Experiment Run
- Social Interaction Behavior Analysis
- Marker-less Multi-Animal Tracking
- Mirror Biting Paradigm
- Learning & Memory Paradigms (To Come)
- Export Data
- Troubleshooting
- License
- Camera Setup
1. Install and Run Application
1.1 Software Installation
The executable is ConductVisionUI\bin\ConductVisionUI. Double click on the executable.
The demo version has a license valid for one month.
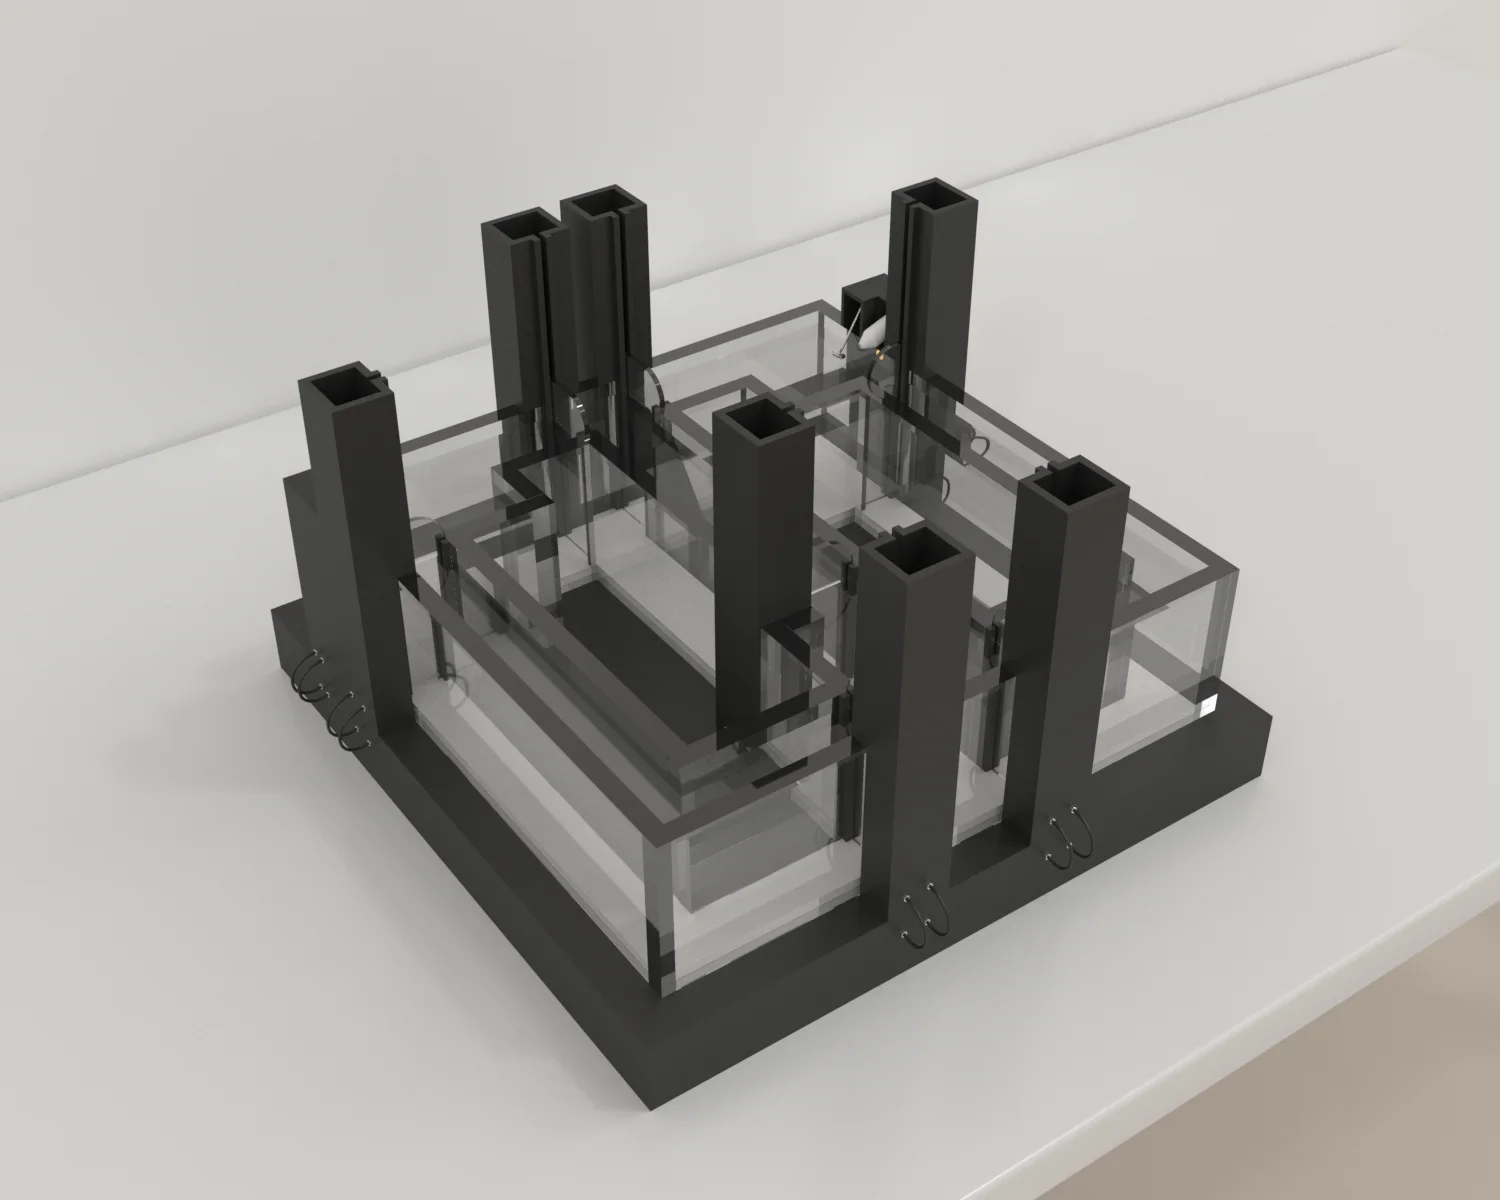
2. Maze Types
Click on the maze type field to view or select a fish maze type. You can switch to another maze without having to restart the application.
For the fish package, there is one type FishOpen for fish open field with focus on multi-fish social interactions.
The ConductVision software supports maze types for fish species as defined in the packages: PackFish.
PackFish includes:
- FishOpen (multi-fish social interaction)
- Y-Maze
- T-Maze
- Mirror Biting maze
3. Video Service Connection
To use AI based video tracking service, the user needs to start the service stream. When the service stream is established, the status field shows text "Started" and color becomes green. If there is a need to stop the stream because of an exception, click on the stop button and then start again.
When the application starts, it is in the stop state.
4. Experiment Configuration
The application provides a user interface to configure and execute experiments (protocols) and view execution results.
4.1 New Experiment
To create an experiment protocol, click on "FishOpen Protocols" on the left panel. A menu item New appears.
Click on New menu item. A "New Experiment" window appears. Fill in an experiment name and click on Save button.
Once the experiment is created, it appears in the folder "FishOpen Protocols".
An experiment can be deleted by right-clicking on the experiment. The current active protocol is indicated in the left bottom of the screen.
4.2 Configure Parameters
To configure an experiment, double click on the experiment under the folder "FishOpen Protocols".
4.2.1 Protocol Parameters
- Trials (1-30) - represents the number of trials to continuously run in the session. The trial is set to 1 for a FishOpen single video or single camera. Multiple trials will be used for batch processing of videos, each trial representing a video.
- Trial Durs(s) - represents the trial duration in seconds
- Auto Trial - If selected, the next trial will automatically start after the completion of a trial. If not selected, a dialog will appear asking the user to place the animal in the starting position before starting.
- Video Source Video file - to track a video file, the user needs to load a video file.
- Video Source camera - this is to track rodent in real-time
- Preview - in living tracking mode, the user can preview the maze; stop preview will produce a thumbnail that can be used for drawing the tracking areas.
- Number of Animals - the social interaction supports up to 10 fish, so the selection ranges from 1 to 10.
4.3 Rectangle Drawing
4.3.1 Video Thumbnail
Rectangular area drawing is required for FishOpen. When a video is selected or a camera is previewed, a video thumbnail is generated and shown on the Video Tracking panel.
4.3.2 Drawing Rectangle
- Click button in the FishOpen Drawing group to enable the drawing mode.
- On the maze, select the point on the left upper corner and drag to the right bottom inside the maze.
- After the drawing, click Save button.
- The rectangle size should be just large enough to cover the maze and animal.
4.4 Ruler
4.4.1 Distance Measurement
In software, the camera image distance is defined as pixels. We are interested in reporting distance meters like cm. So, we need to know the pixels distance on screen maps to meter distance cm.
4.4.2 Ruler Drawing
- Click on the Show Ruler button, and a line appears on the maze.
- Draw the ends of the line to two end points of the maze.
- Enter the real distance in the field. For example, the dimension of the standard open field maze from Maze Engineers is 40 x 40 cm so you enter 40.
- Click Save button to save the data.
- Click on the Ruler button again to exit the ruler drawing mode.
5. Experiment Run
To execute an experiment, select the protocol under "Protocols" on the left navigation panel and double click on it. Make sure the service stream is connected.
5.1 Run Experiment
Enter a name for the experiment run and click Start button. This will set system in the running state.
When the start button is clicked, the state of button becomes Stop. The user can click on a stop button to stop the session run.
The experiment will stop when total time reaches, or all trials are completed, or the user stops it.
In the Video Tracking panel, the animal moves are tracked.
In the Tracking Details panel, the track details are recorded. The data grid only shows the latest trial. When a trial is completed, the tracking data is saved.
5.2 Tracking Data
The tracking data on the Protocol tab is organized in a tree structure. For example, if the number of animals is 10, for each frame, there are ten rows, each for one fish and a parent row.
To expand the data grid, double click on the left keyboard mouse; to collapse the data grid, double click on the right keyboard mouse.
5.3 Result Tables
Select the result from the left Experiment Result. The results are shown on the Result tab. There are five panels to show the results:
- Replay Details: contains all tracking data of the protocol run.
- Replay: allows user to replay the video at a user defined speed or frame by frame.
- Social Interactions: defines social interaction parameters and analyzes the social interaction behaviors.
- Summary Result: Calculate and display the summary of social interaction behaviors.
- Current Selection: display the protocol run start and end timestamps.
5.4 Tips of Grid Data View
In the application, the UI Tree Grids are used. To expand the tree data grid, double click on the left keyboard mouse; to collapse the data grid, double click on the right keyboard mouse.
5.5 Video Tracking Replay
5.5.1 Video Replay
The panel allows the user to replay the video at a user's preferred speed.
The panel can also let the user search for a certain frame and navigate forward and backward frame by frame.
The tracking key point data is highlighted along with the move of the frames.
This gives users the tool to review videos and closely examine animal behaviors.
5.5.2 Display Properties
The display colors, size and body part selections can be configured in the Properties dialog.
6. Social Interaction Behavior Analysis
6.1 Key Points
Conduct Vision is an AI based video tracking system. Key points are manually annotated on the animals' bodies to create a labeled dataset for training. A pre-trained model is then fine-tuned on this dataset to adapt to the specific animal species and experimental conditions. The model predicts the 2D coordinates of key points (body parts) in each frame by generating heatmaps, where each heatmap represents the likelihood of a specific key point being at each pixel location.
Five key points are chosen: nose, left eye, right eye, body and tail.
6.2 Social Interaction Definitions
6.2.1 Shoaling
For shoaling behavior analysis, ConductVision software tracks multiple zebrafish and measures parameters like inter-individual distance, group cohesion, and alignment:
- Inter-fish distance: Average distance between individuals.
- Alignment: How parallel the fish swim.
- Shoal cohesion: Variability in inter-fish distances (lower values = tighter shoal).
- Speed & acceleration: Individual vs. group-level movement.
The user can choose a fish body part for measurements like inter-distance and can choose all fish in the group or a subgroup of fish.
The user can open the documents from this panel.
6.3 Social Interaction Analysis
6.3.1 Analysis Parameters and Run
Select the parameters and click the RunAll button to run the calculations. The results are in the tabs of Shoaling, Shoaling Chart and Shoaling Heat Map.
Save button will save the parameter, result summary and each behavior analysis (Shoaling, Mirror Biting, etc.).
When a result is selected from the FishOpen Results, the saved parameters and result summary will be populated.
6.3.2 Shoaling Behavior Analysis
Pair: The fish pair. For two fish, the only pair is 1-2. For three fish, there are pairs (1-2, 1-3, 2-3, 1-2-3). For four fish, there are pairs (1-2, 1-3, 1-4, 2-3, 2-4, 3-4, 1-2-3, 1-2-4, 2-3-4, 1-2-3-4). For simplicity, the groups of more than two animals are also called pairs.
DistCmNoseToNose: the distance in cm between noses of two animals
DistCmBodyToBody: the distance in cm between bodies of two animals
InterDistCm: the distance in cm between two animals. For each frame, the distance of each pair is between two noses or two bodies depending on the body part selection. For the group the inter-distance is the average of pairs.
InterDistStdev: Standard deviation of the InterDistCm is at the group level. It is based on the InterDistCm of all pairs in the group.
Align Angle: It measures how parallel the fish swim. The angle is between 0 and 180 degrees. For each frame, the angle of each pair is between two vectors (body to nose direction vector). For the group the align angle is the average of pairs in the group.
Speed Cm/Sec: the speed in cm per second between two animals. For each frame, the speed of each pair is the average of two fish. For the group the speed is the average of pairs in the group.
6.4 Result Summary
The table lists the group and all pairs.
- DistCmMean: the average of the InterDistCm across all frames
- DistCmStdev: the standard deviation of the InterDistCm across all frames
- Angle Degree Mean: the average AlignAngle across all frames for pairs and the group
- Angle Degree Stdev: the standard deviation of the AlignAngle across all frames
- SpeedCm/s: the average speed across all frames for pairs and the group
If the parameters are adjusted and analysis is recalculated, the Calc button will recalculate the result summary, but the result will not be automatically saved.
6.5 Shoaling Chart
The behavior measures: Inter-Dist, Angle, Speed
Subject: fish pairs or the entire group
6.6 Shoaling Heat Map
6.6.1 Fish Shoaling Heat Map
Select a result and go to Shoaling Heat Map tab.
Select parameters then press the Calc button. The Heat Map is visualized on the grid.
Pair: list available pairs and Group at the group level. For example, for 10 fish, there are 45 pairs (P1-2, P1-3, etc.) and a group for all 10 fish.
Body Part: Nose or Body to calculate the inter-distance in cm.
Dist (cm): distance threshold. Select the frames that the pair inter-distance is smaller than the threshold. For the group, the inter-distance is the mean of all pairs.
Period(s): Time range of the frames to be included in the heat map.
The parameters can be saved by pressing the save button.
6.6.2 Heat Map Calculation
This heat map shows the animal's movement in a maze using animal position X, Y. The value at each coordinate indicates how many times the animal has been observed at that location. These counts are converted into percentages by comparing each point's count to the data size. This percentage then determines the color of each point: 0% activity is mapped to dark blue (low activity), and 100% activity is mapped to dark red (high activity). Thus, cooler colors (e.g., blue) indicate low activity, while warmer colors (e.g., red) represent higher activity levels.
6.6.3 Heat Map Image Export
The heat map image can be exported as a high-resolution image file.
7. Marker-less Multi-Animal Tracking
7.1 Marker-less Tracking Technologies
In multi-animal tracking scenarios, individual animals are identified and tracked independently, even in cases of overlapping or occlusions. This is achieved by incorporating identity tracking mechanisms and enforcing spatial constraints to maintain consistent tracking across frames.
There are two steps of data capture and processing.
First, animal key point estimation is performed using Fully Convolutional Networks (FCNs) based on deep neural network architectures such as YOLO (You Only Look Once) and ResNets (Residual Networks). Initially, key points are manually annotated on the animals' bodies to create a labeled dataset for training. A pre-trained model is then fine-tuned on this dataset to adapt to the specific animal species and experimental conditions. The model predicts the 2D coordinates of key points (body parts) in each frame by generating heatmaps, where each heatmap represents the likelihood of a specific key point being at each pixel location.
Secondly, to maintain consistent identities across frames, algorithms such as the Hungarian algorithm for bipartite graph matching or Kalman filtering are employed. These algorithms leverage spatial proximity, motion coherence, and temporal information to associate detected key points with their respective animals over time.
On the software, the tracking data presented on the protocol tab during the tracking is a result of step 1 so there are some cross points among animals. The step 1 tracking is displayed so that the user can view the progress of the video tracking. The final tracking data on the result tab is the result of the final (two steps) process so that the animals are identified consistently across frames. The two step results are used for social interaction analysis.
7.2 Step 1 Tracking Data
This is for users to view tracking progress.
7.3 Final Tracking Data
The final tracking data is consistent across frames and used for social interaction behavior analysis.
7.4 Tracking Accuracy
The trained model is based on fine-tuned on this dataset to adapt to the specific animal species and experimental conditions.
To create a trained model, key points are manually annotated on the animals' bodies to create a labeled dataset for training. The dataset is constructed using wide ranges of videos that have mazes colors (white, black, grey and blue), animal colors (white and black) and light conditions (normal and IR).
It is normal that the labs have different recording environments (mazes, animals and lighting conditions). If the tracking accuracy is low, we have recommendations:
- Improve the video recording quality. Our sample videos can show the expected quality and results.
- The lab videos can be added to the trained model to achieve high tracking accuracy.
8. Mirror Biting Paradigm
8.1 Protocol
A fish is exposed to its reflection in a mirror. Used to measure aggression levels (common in zebrafish).
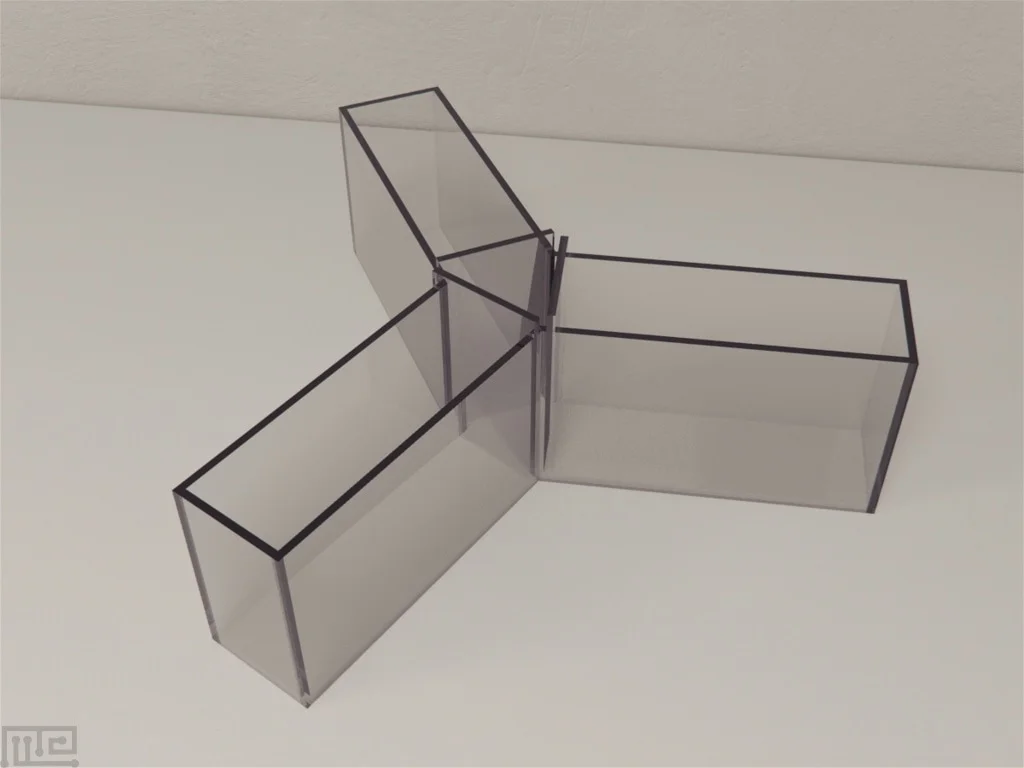
9. Learning & Memory Paradigms (To Come)
9.1 Y-Maze
- Assesses spatial learning and memory by requiring fish to choose the correct arm.
- Used in Alzheimer's models, cognitive function tests, and associative learning studies.
9.2 T-Maze
- Assesses spatial learning and memory by requiring fish to choose the correct arm.
- Used in Alzheimer's models, cognitive function tests, and associative learning studies.
9.3 Avoidance Learning Test
- Fish learn to avoid a specific area associated with an aversive stimulus (e.g., mild shock, bright light).
- Used in fear conditioning and memory tests.
10. Export Data
- Select a result
- Click the Export button
- The output file format is .csv
11. Troubleshooting
11.1 Log Display
- The log content can be displayed on the screen.
- The log file is in the Log folder under your deployment folder.
11.2 Database Files and User Data
The database file contains the protocols and results. There is a separate folder containing database files and video data for each maze under the bin folder.
12. License
Demo version: The demo version is valid for one month from the download and no license is required.
Production version: If you receive the production key file from Conduct Vision support team, replace the old license file.
For us to generate a license, you will need to provide us with two machine names where Conduct Vision software is intended to run.
There are two ways to find the computer name:
Method 1: From Control Panel. It works for Windows 10 and Windows 11.
Method 2: For Windows 11, from Start button → System → About
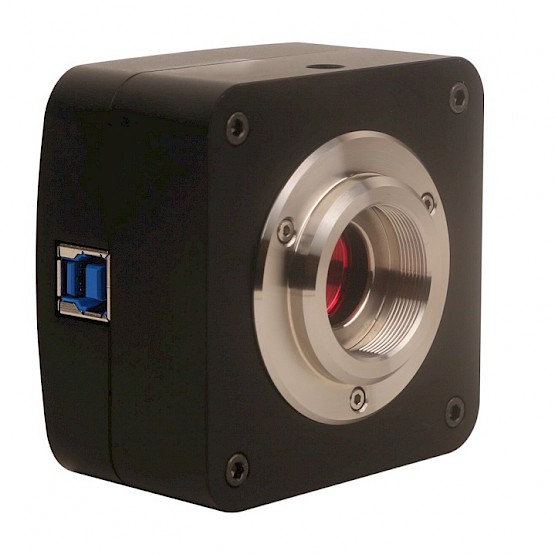
13. Camera Setup
If one of our provided cameras is used, no drivers or software is required for the camera to function.
Steps:
- Disable any other cameras on the computer under "Device Manager"
- Plug the camera into the computer's USB port. You should hear a noise to indicate the computer has recognized the camera.
- Open the computer's camera app to confirm the camera's connection and adjust the camera's view.
- Either record subject trials in advance using your computer's camera app or open the ConductVision application for live streaming.