
Conduct Vision Fly Software Manual
Contents
- Install and Run Application
- Maze Types
- Video Service Connection
- Experiment Configuration
- Experiment Run
- Social Interaction Behavior Analysis
- Marker-less Multi-Animal Tracking
- Export Data
- Troubleshooting
- Camera Setup
1. Install and Run Application
1.1 Software Installation
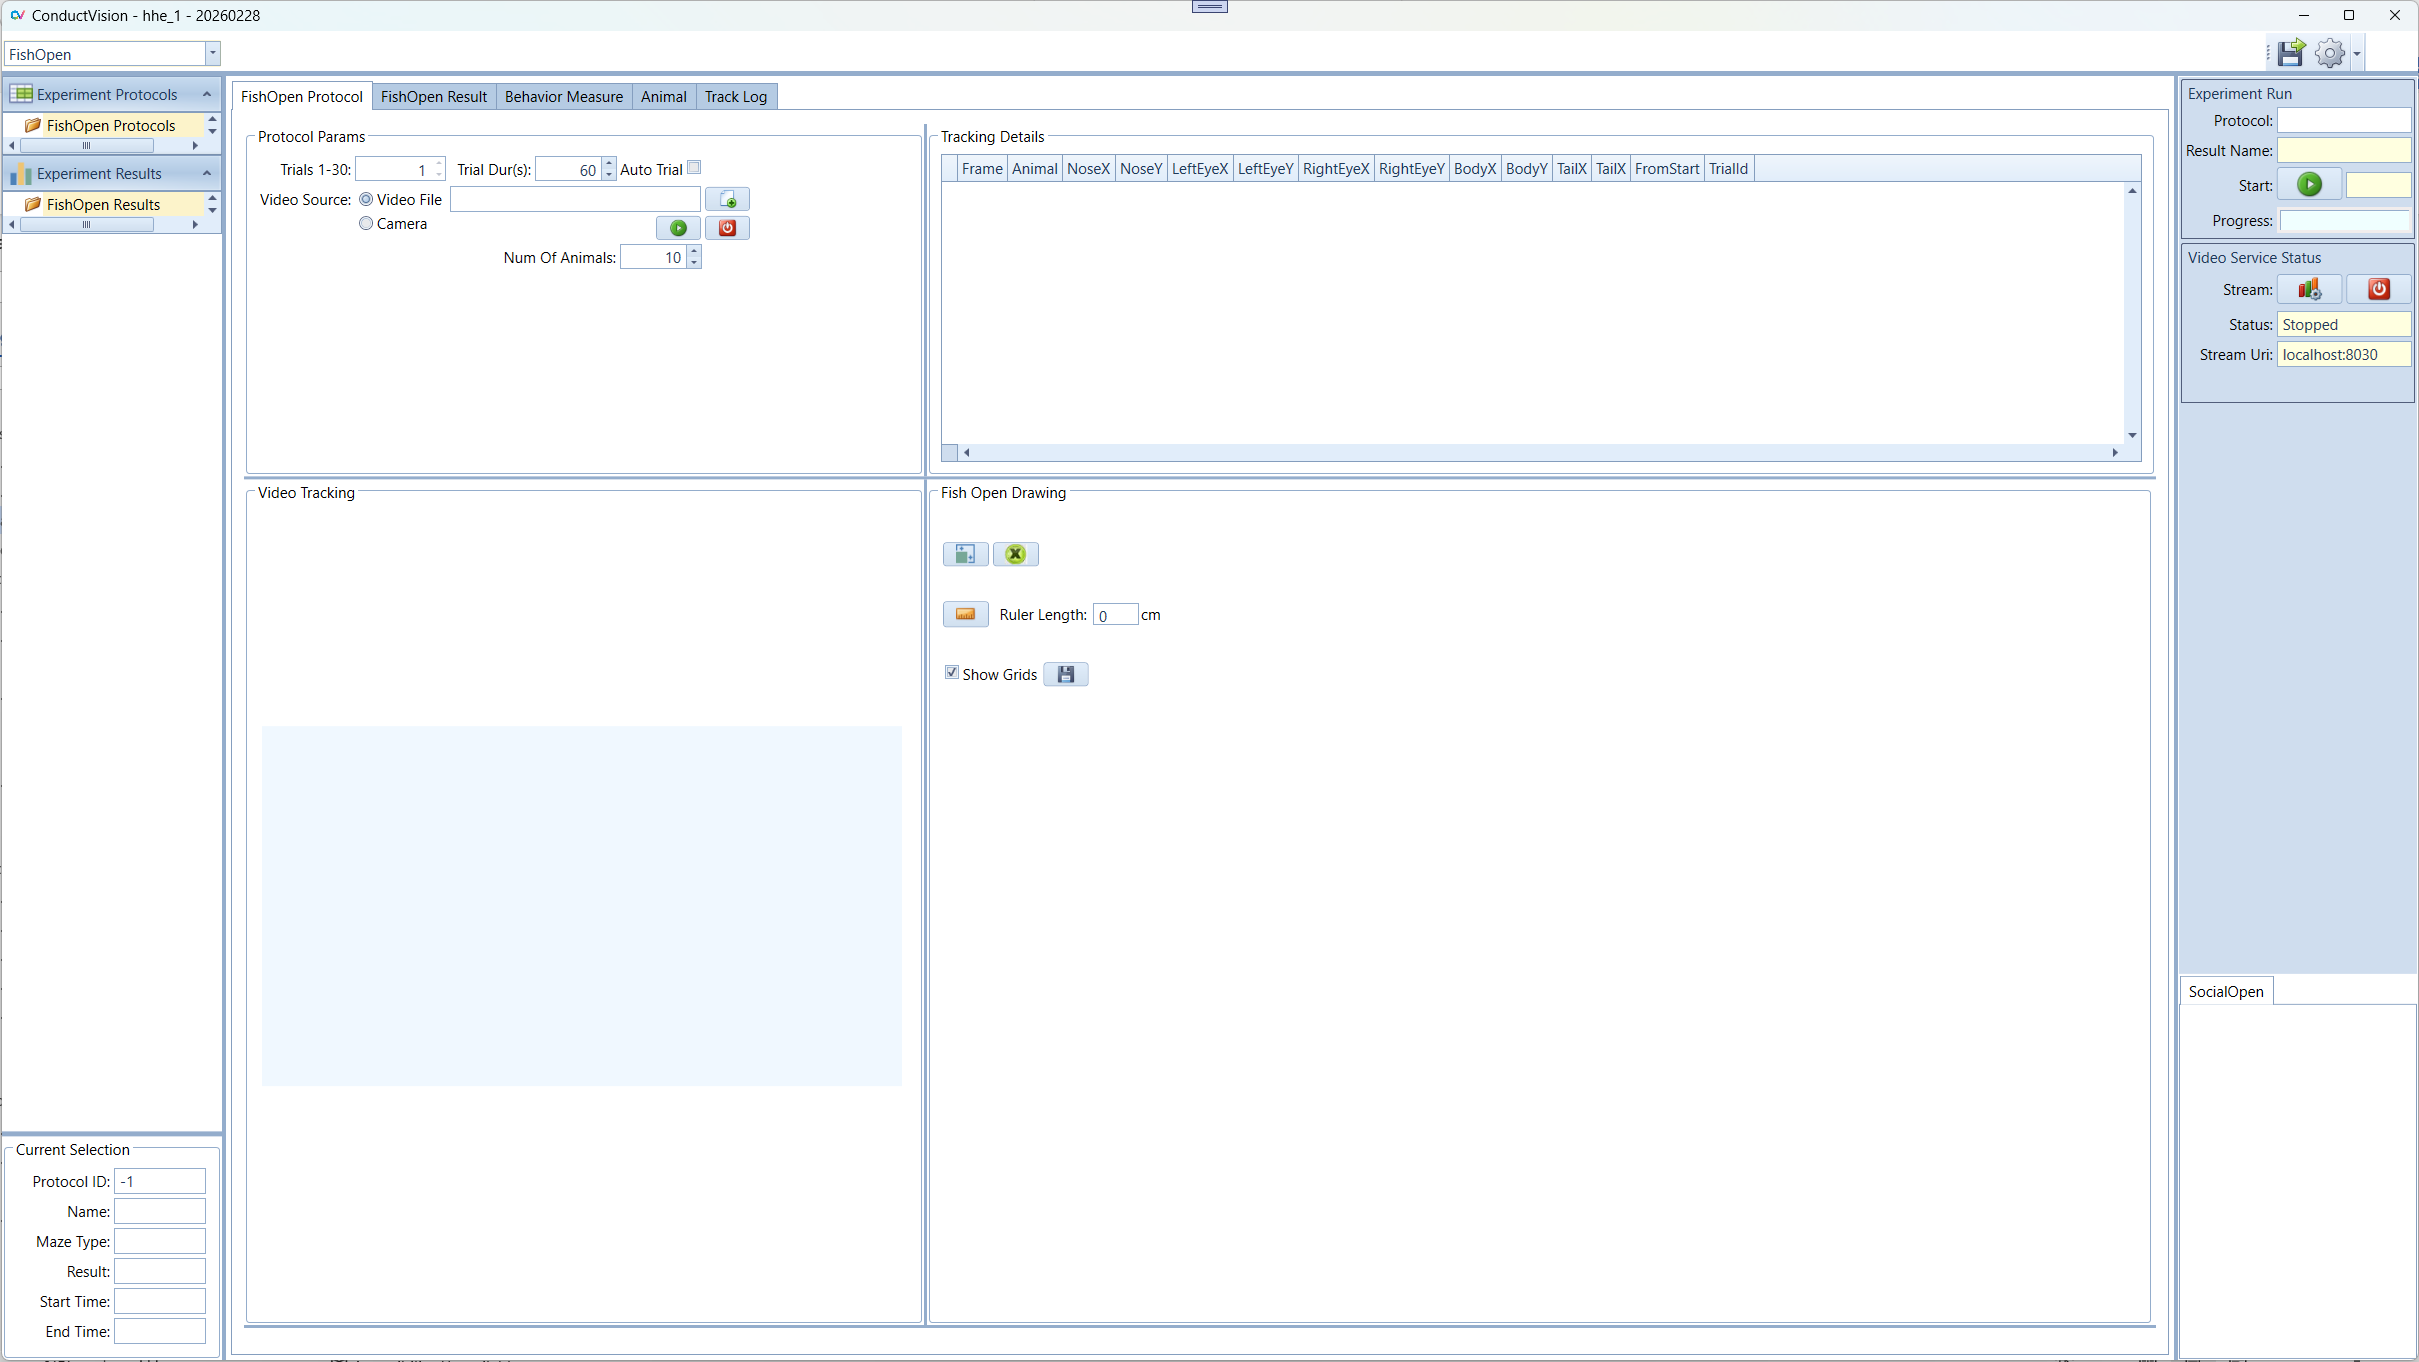
The executable is ConductVisionUI\bin\ConductVisionUI. Double click on the executable. The application appears as below:
2. Maze Types
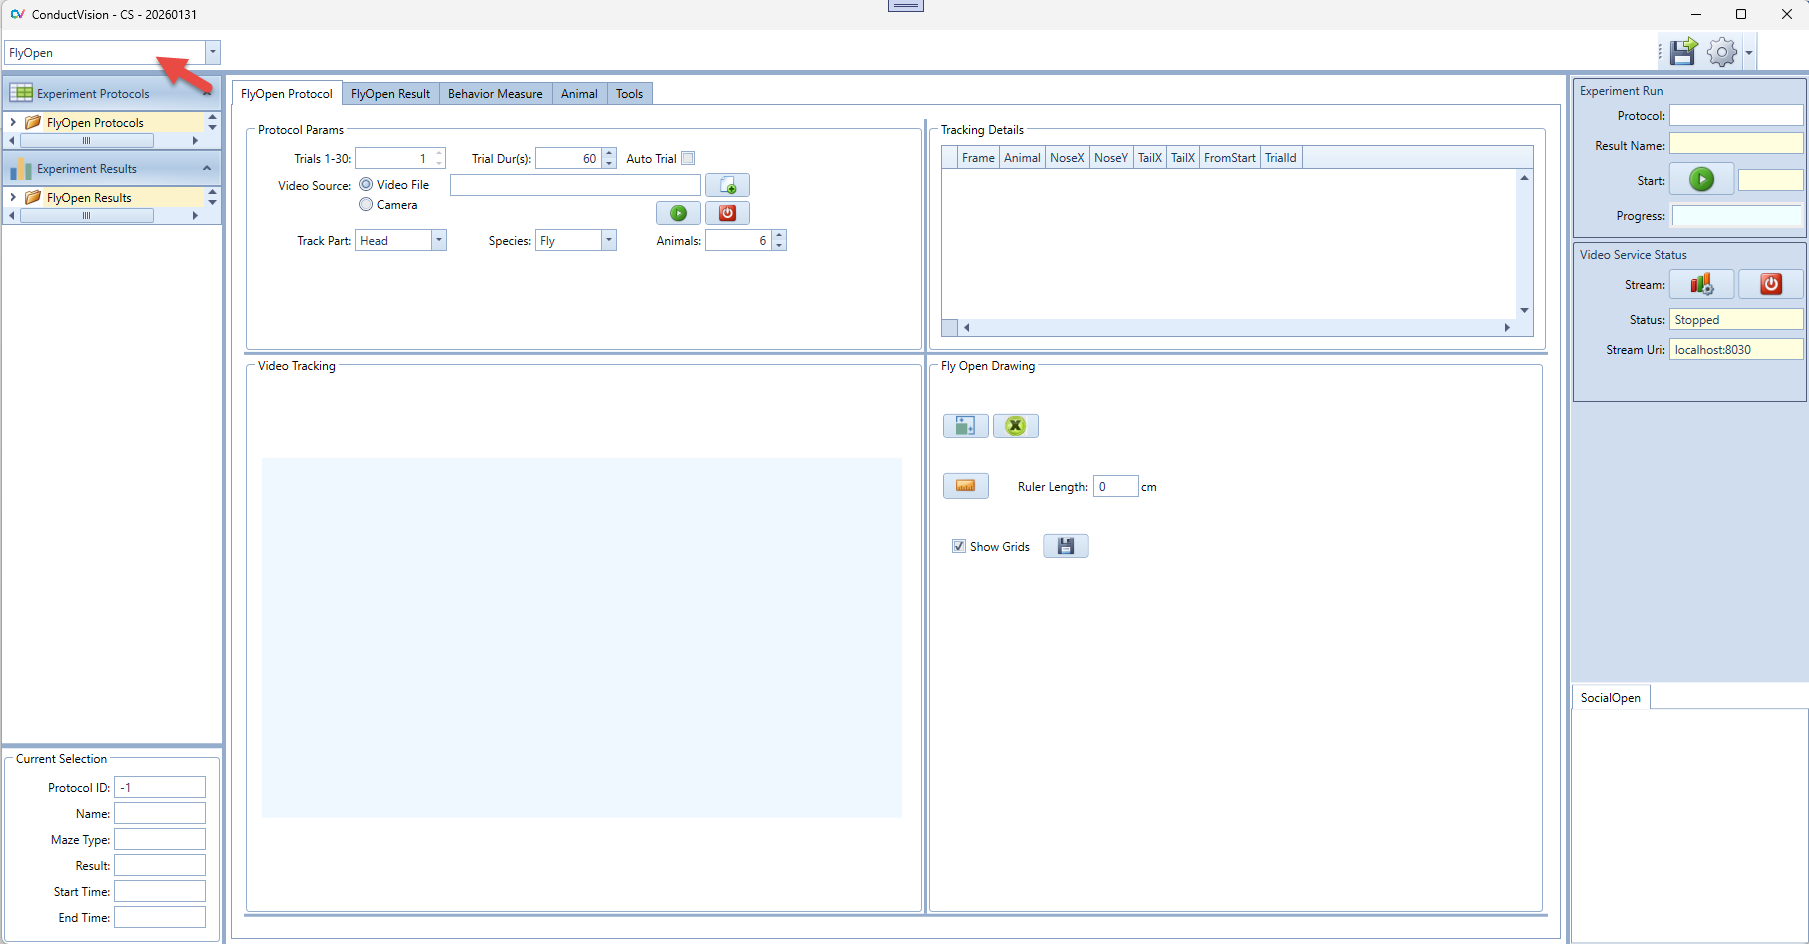
Click on the maze type field to view or select a fly maze type. You can switch to another maze without having to restart the application.
For the fly package, there is one type FlyOpen for Fly open field with focus on multi-fly social interactions.
The ConductVision software supports maze types for fly species as defined in the packages: PackFly.
- PackFly: FlyOpen, Y-maze, T-Maze, Mirror Biting maze
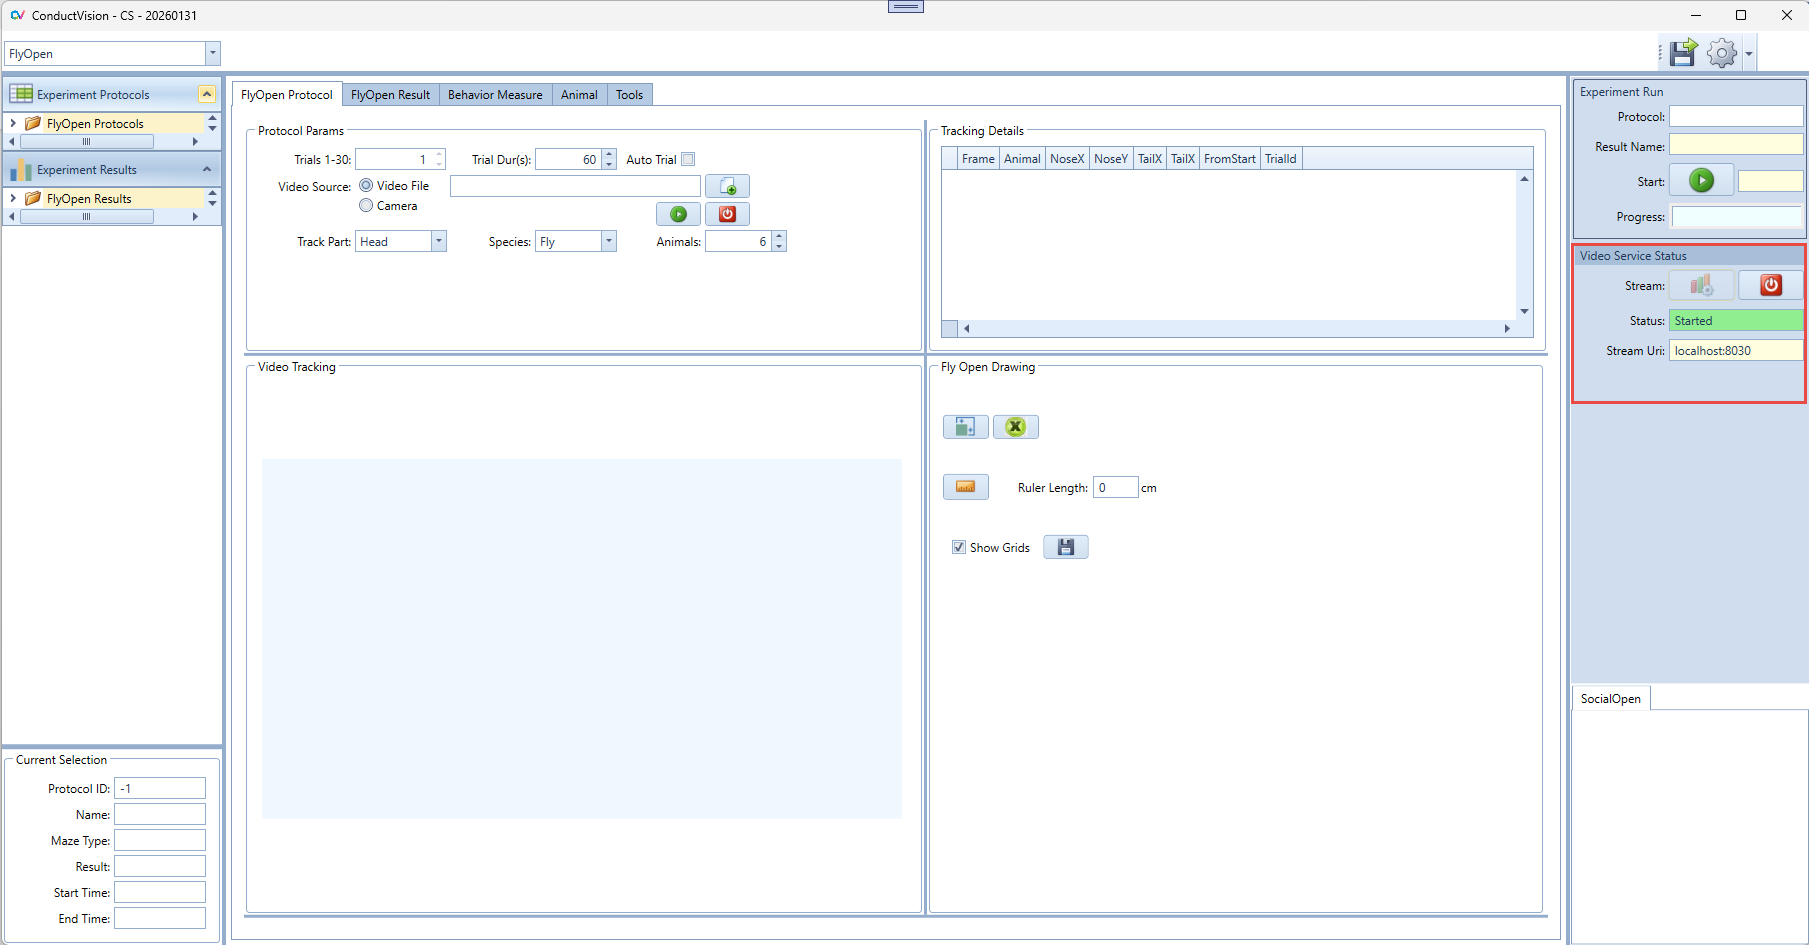
3. Video Service Connection
To use AI based video tracking service, the user needs to start the service stream. When the service stream is established, the status field shows text Started and color becomes green. If there is a need to stop the stream because of an exception, click on the stop button and then start again.
When the application starts, it is in the stop state.
4. Experiment Configuration
The application provides a user interface to configure and execute experiments (protocols) and view execution results.
4.1 New Experiment
To create an experiment protocol, click on "FlyOpen Protocols" on the left panel. A menu item New appears as shown below:
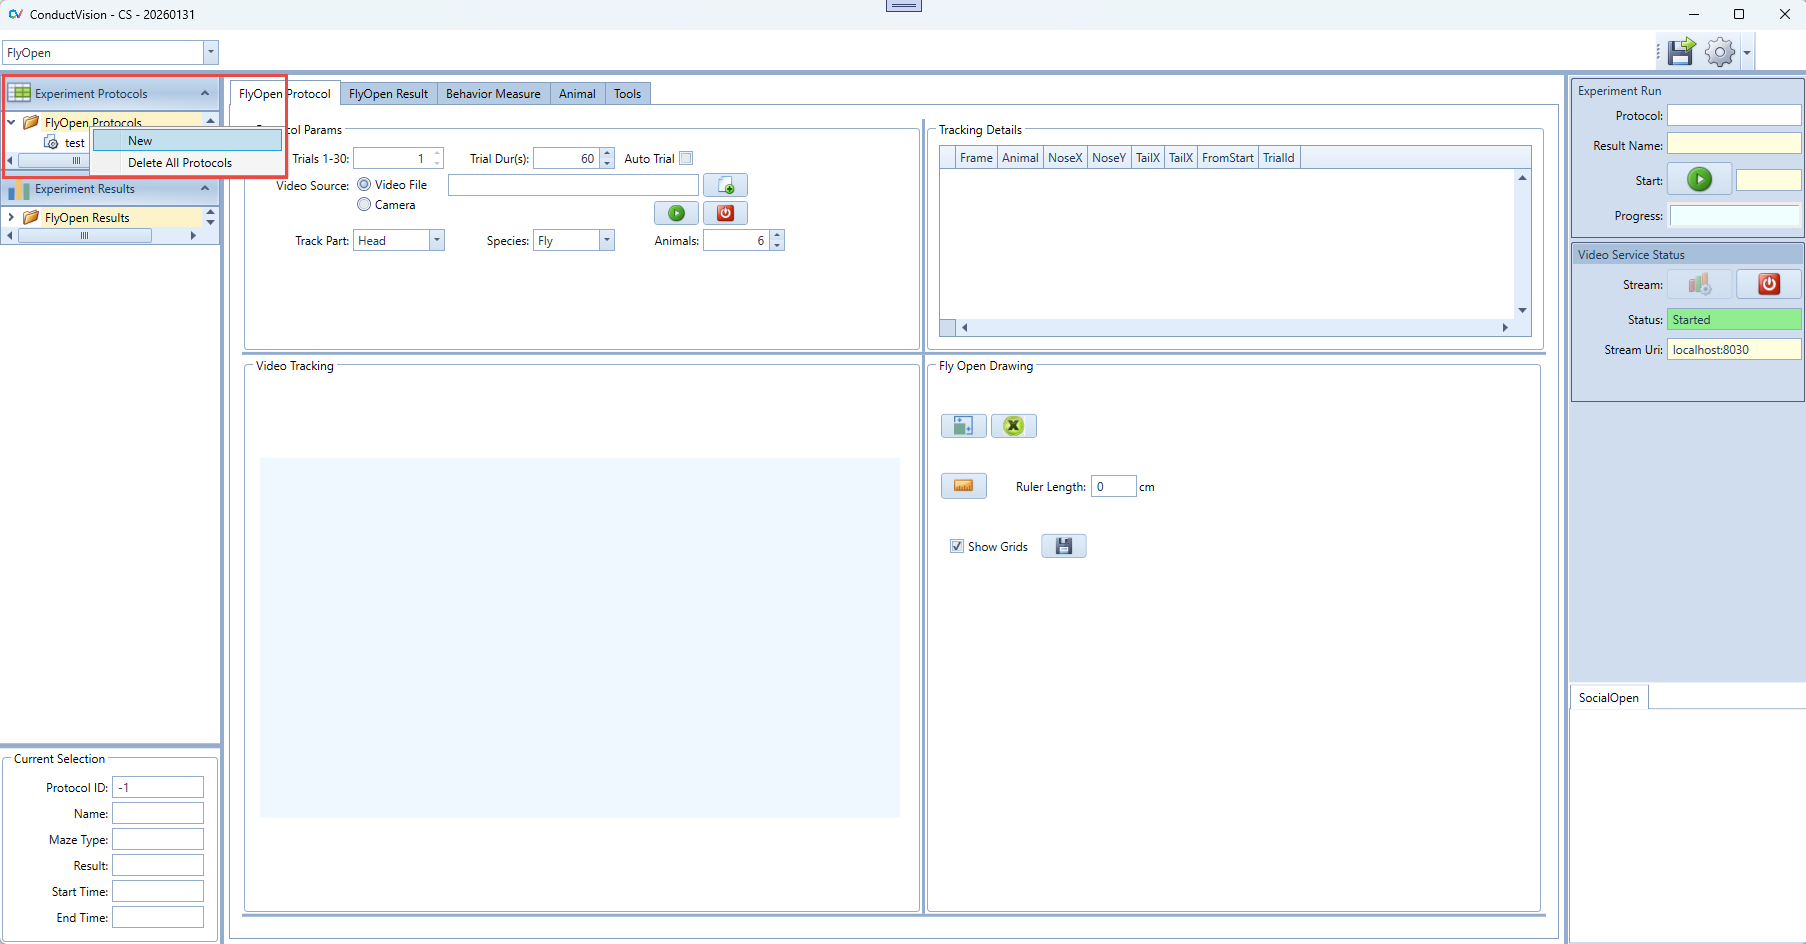
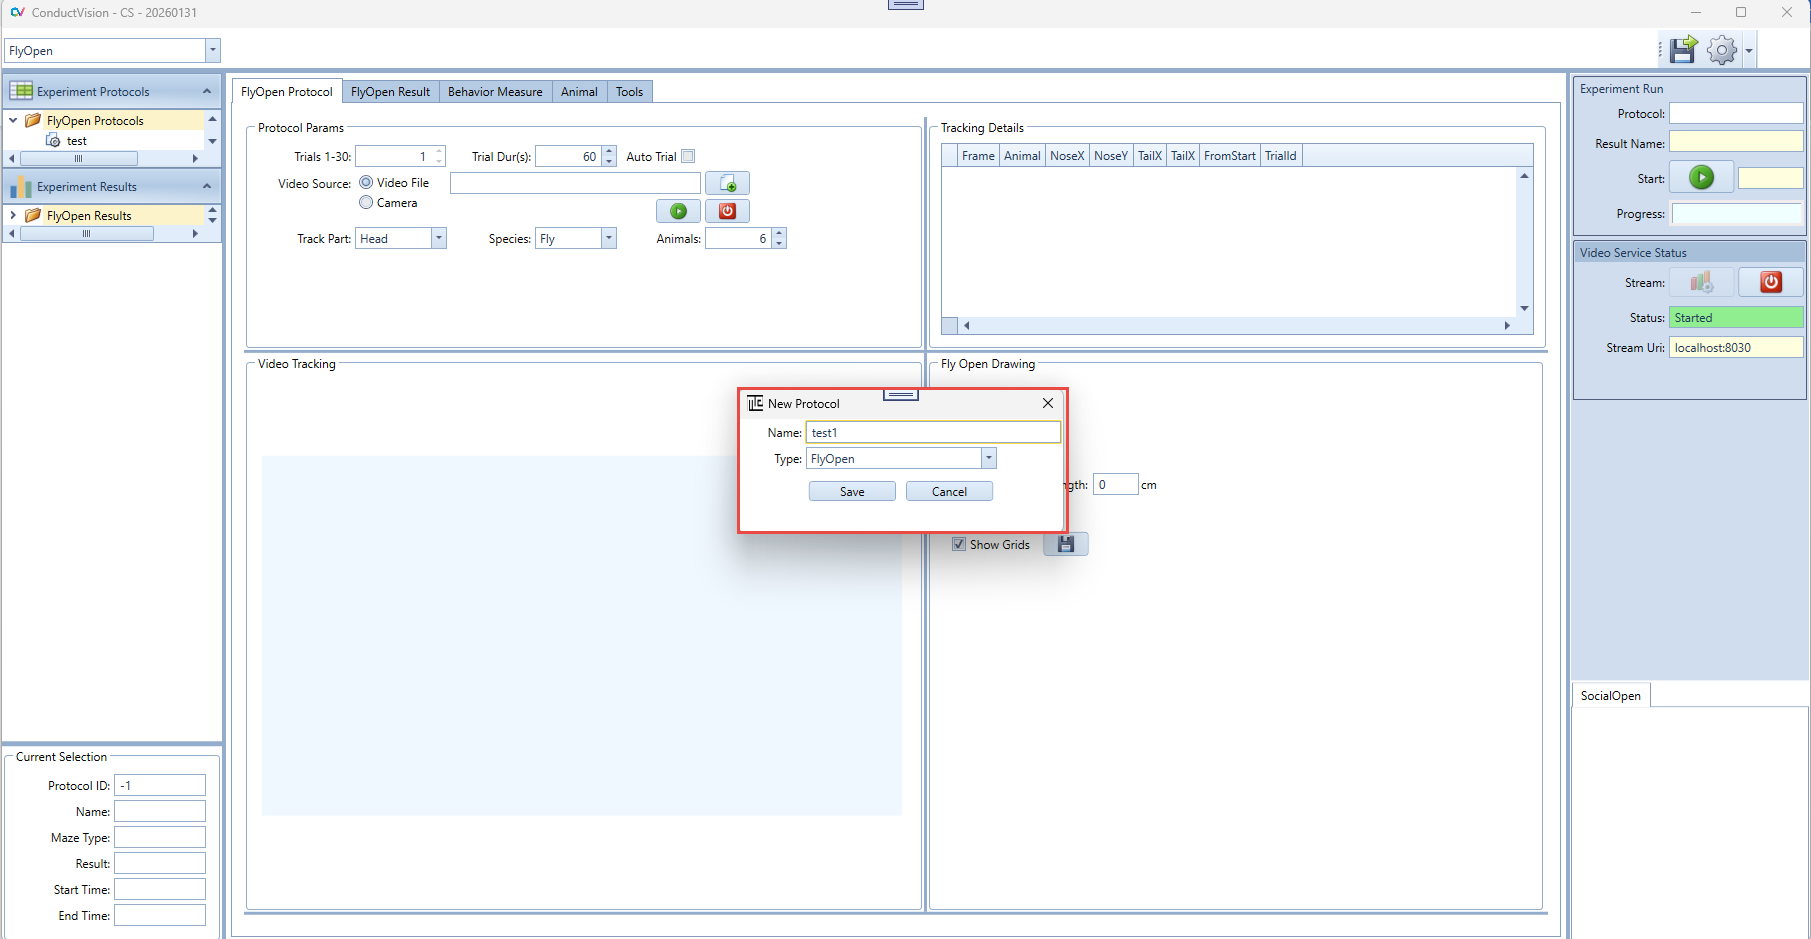
Click on New menu item, a "New Experiment" window appears as shown below. Fill in an experiment name and click on Save button.
Once the experiment is created, it appears in the folder "FlyOpen Protocols" as shown below, double click the experiment just created:
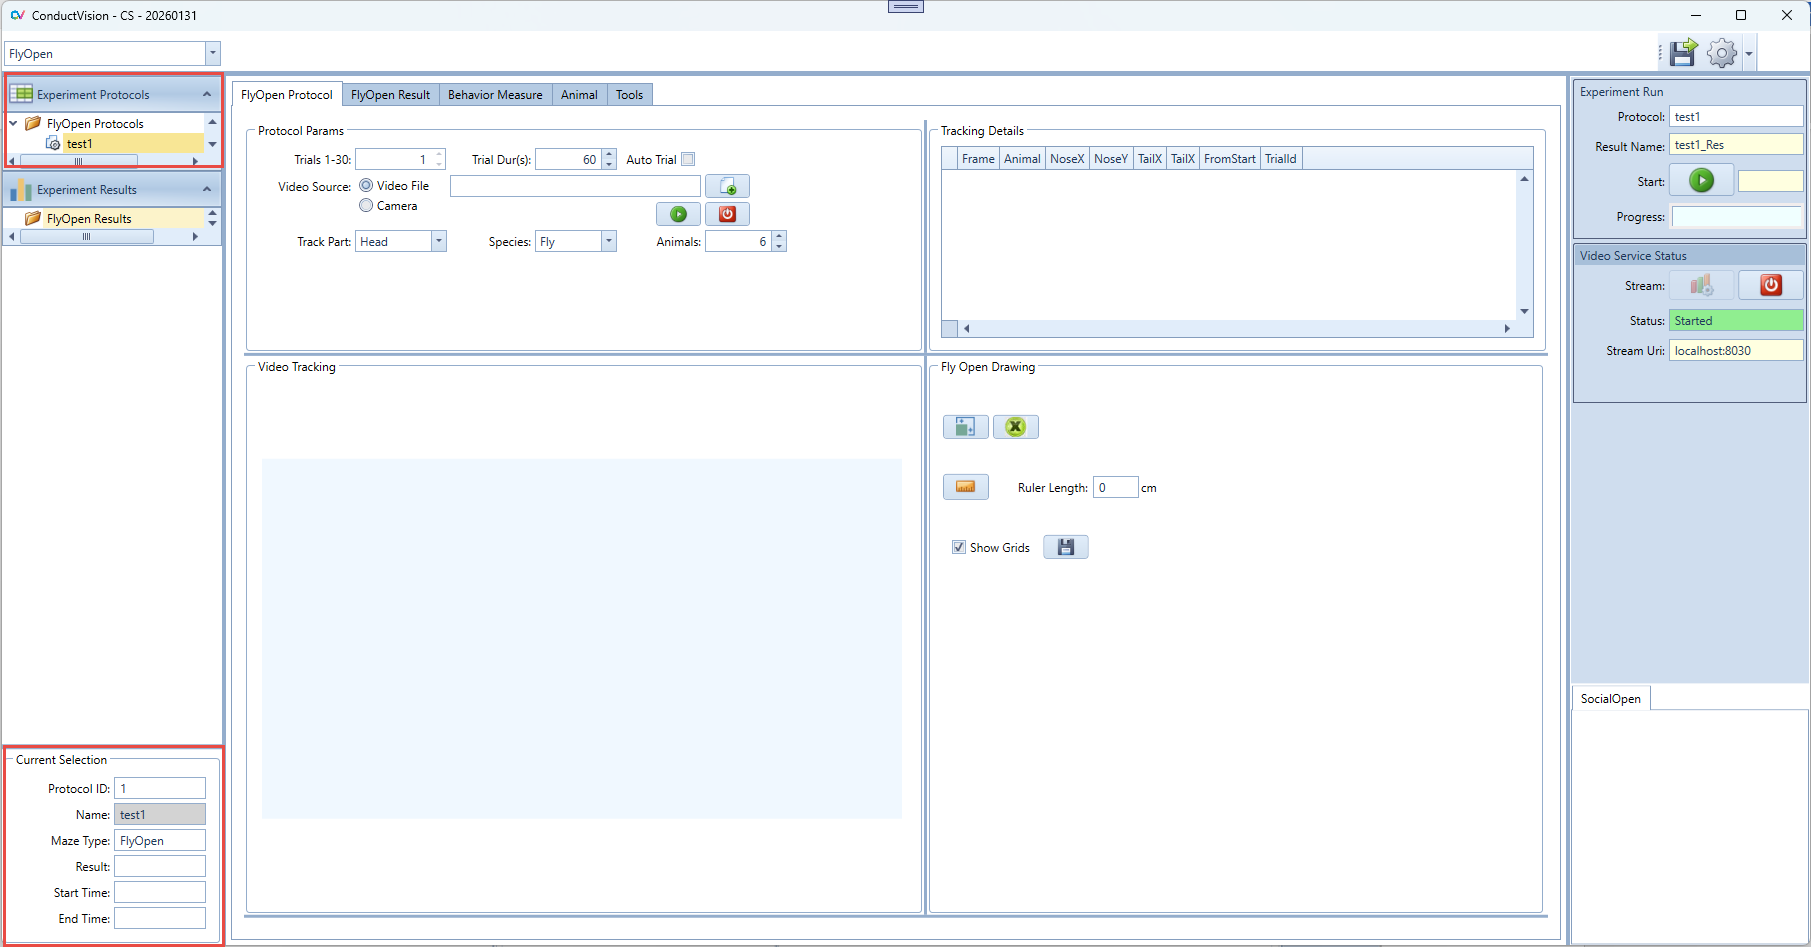
An experiment can be deleted by the right click on the experiment. The current active protocol is indicated in the left bottom of the screen.
4.2 Configure Parameters
To configure an experiment, double click on the experiment under the folder "FlyOpen Protocols".
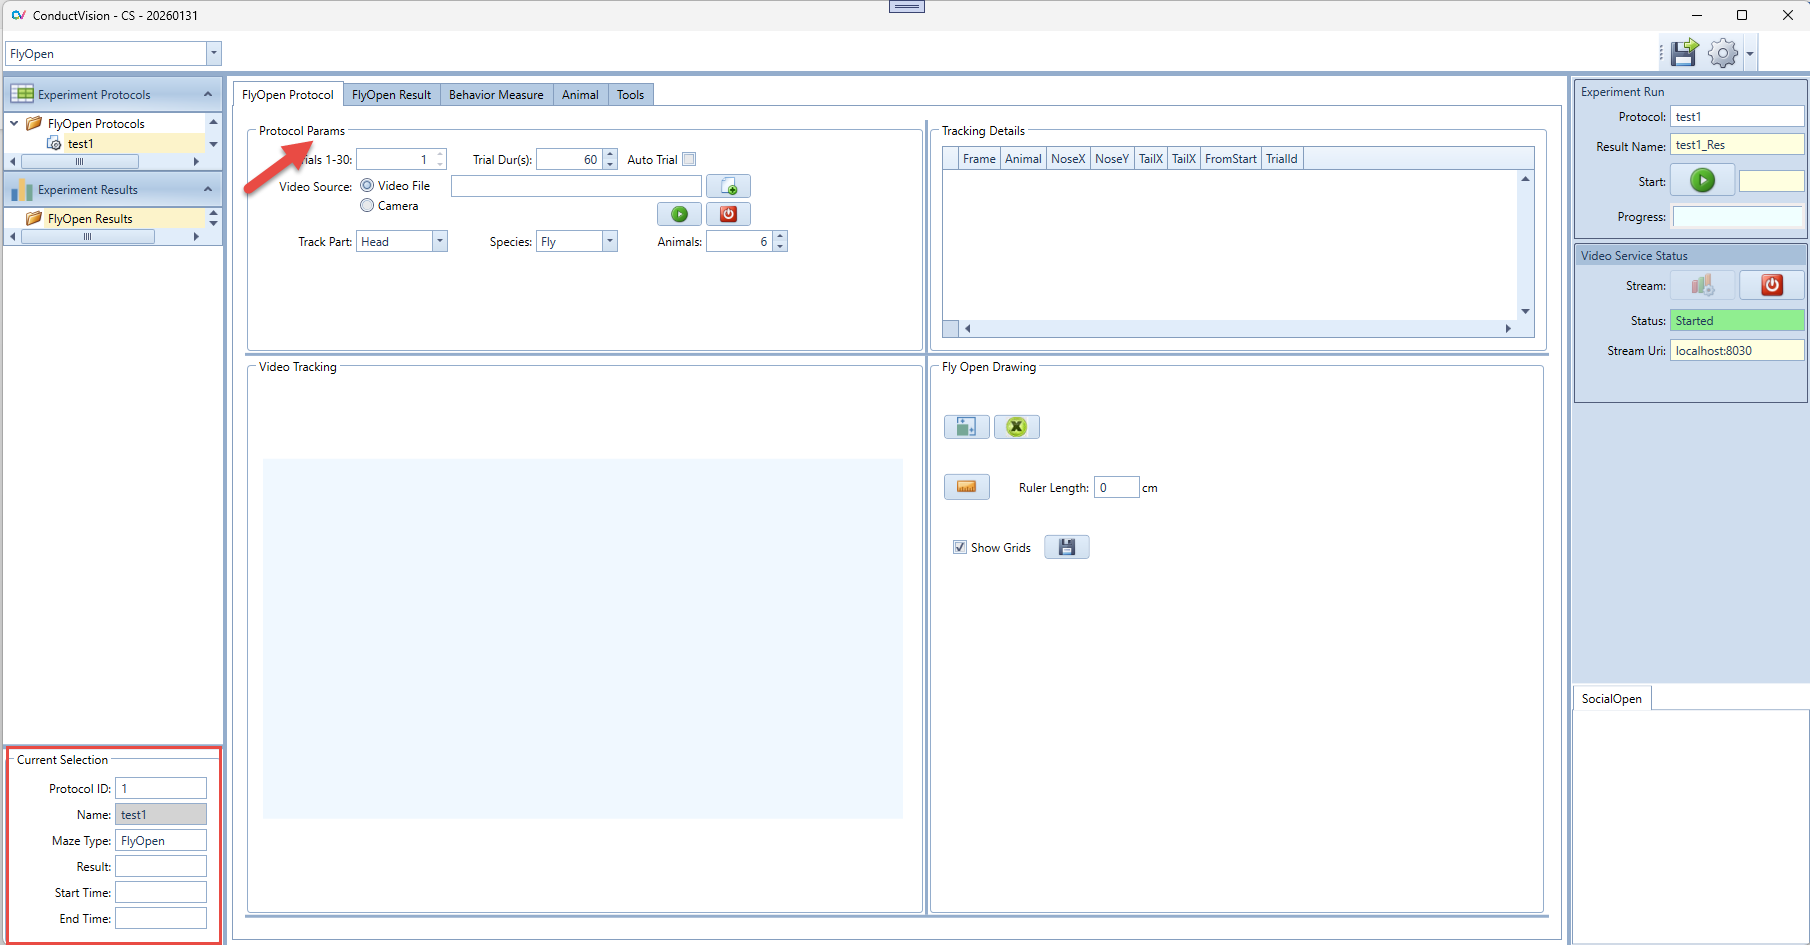
4.2.1 Protocol Parameters
- Trials (1-30) - represents the number of trials to continuously run in the session. The trial is set to 1 for a FlyOpen single video or single camera. Multiple trials will be used for the batch processing of videos, each trial representing a video.
- Trial Durs(s) - represents the trial duration in seconds
- Auto Trial – If selected, the next trial will automatically start after the completion of a trial. If not selected, a dialog will appear asking the user to place the animal in the starting position before starting.
- Video Source Video file - to track a video file, the user needs to load a video file.
- Video Source camera – this is to track rodent in real-time
- Preview – in living tracking mode, the user can preview the maze; stop preview will produce a thumbnail that can be used for drawing the tracking areas.
- Number of Animals – support up to 30 flies.
4.3 Rectangle Drawing
4.3.1 Video Thumbnail
Rectangular area drawing is required for FlyOpen. When a video is selected or a camera is previewed, a video thumbnail is generated and shown on the Video Tracking panel. For example, when a video file is selected, the video thumbnail is shown as shown below.
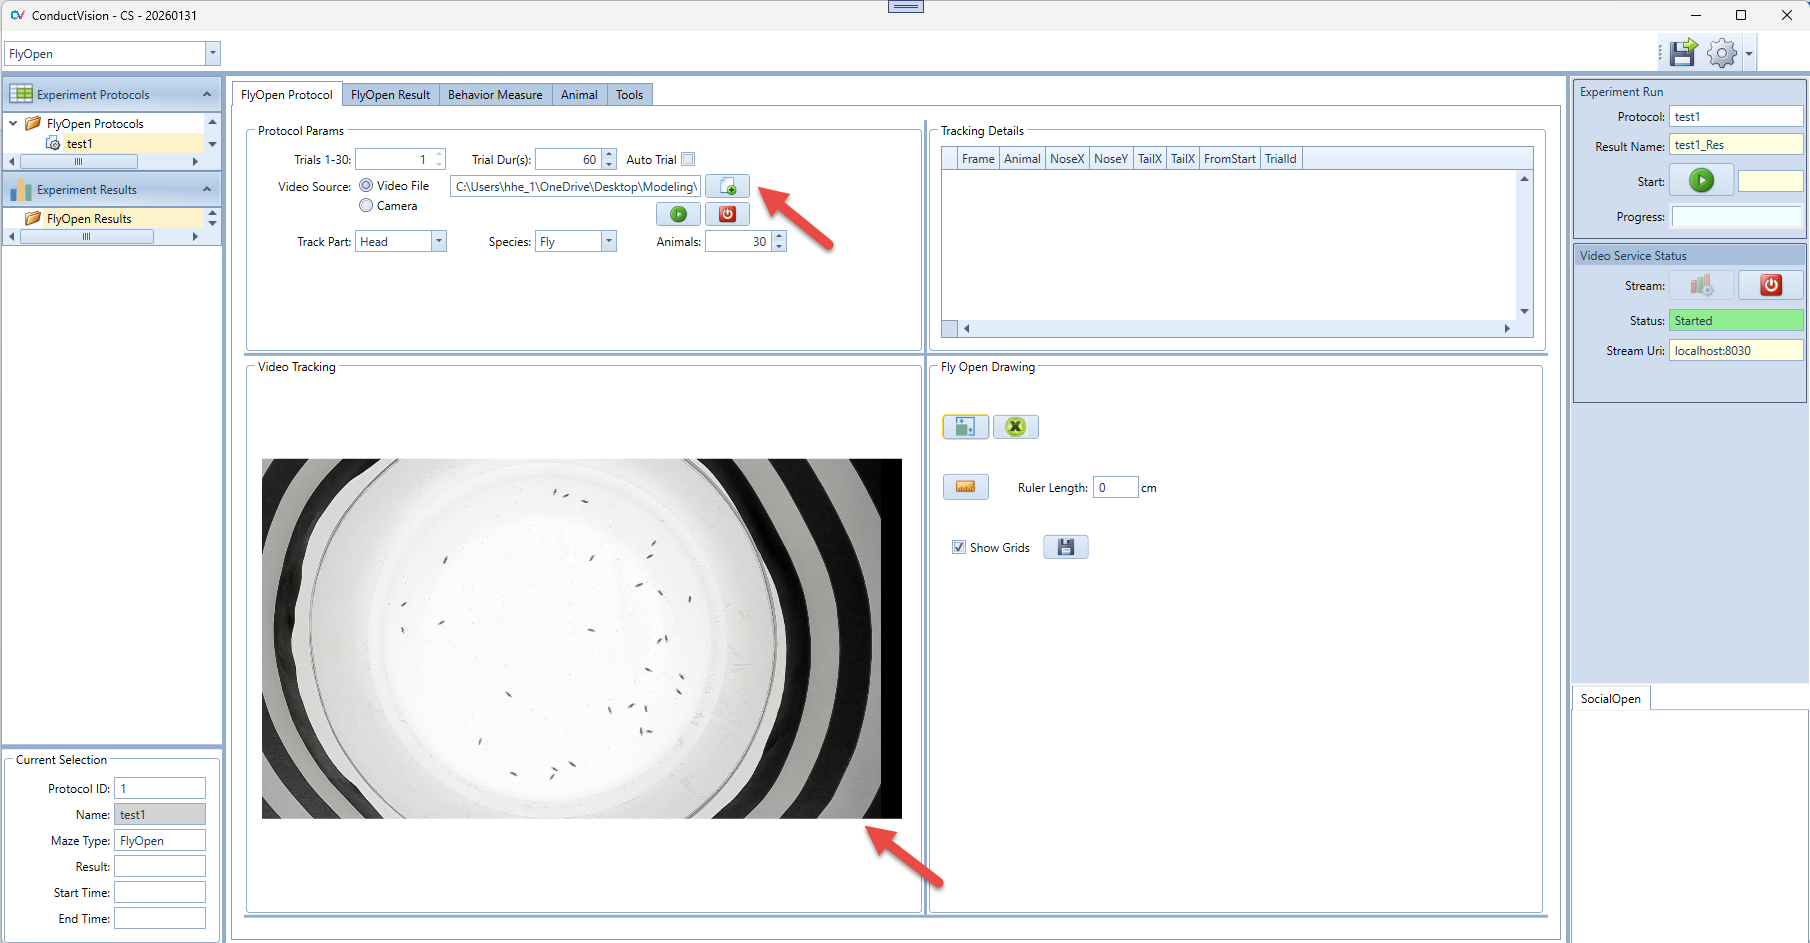
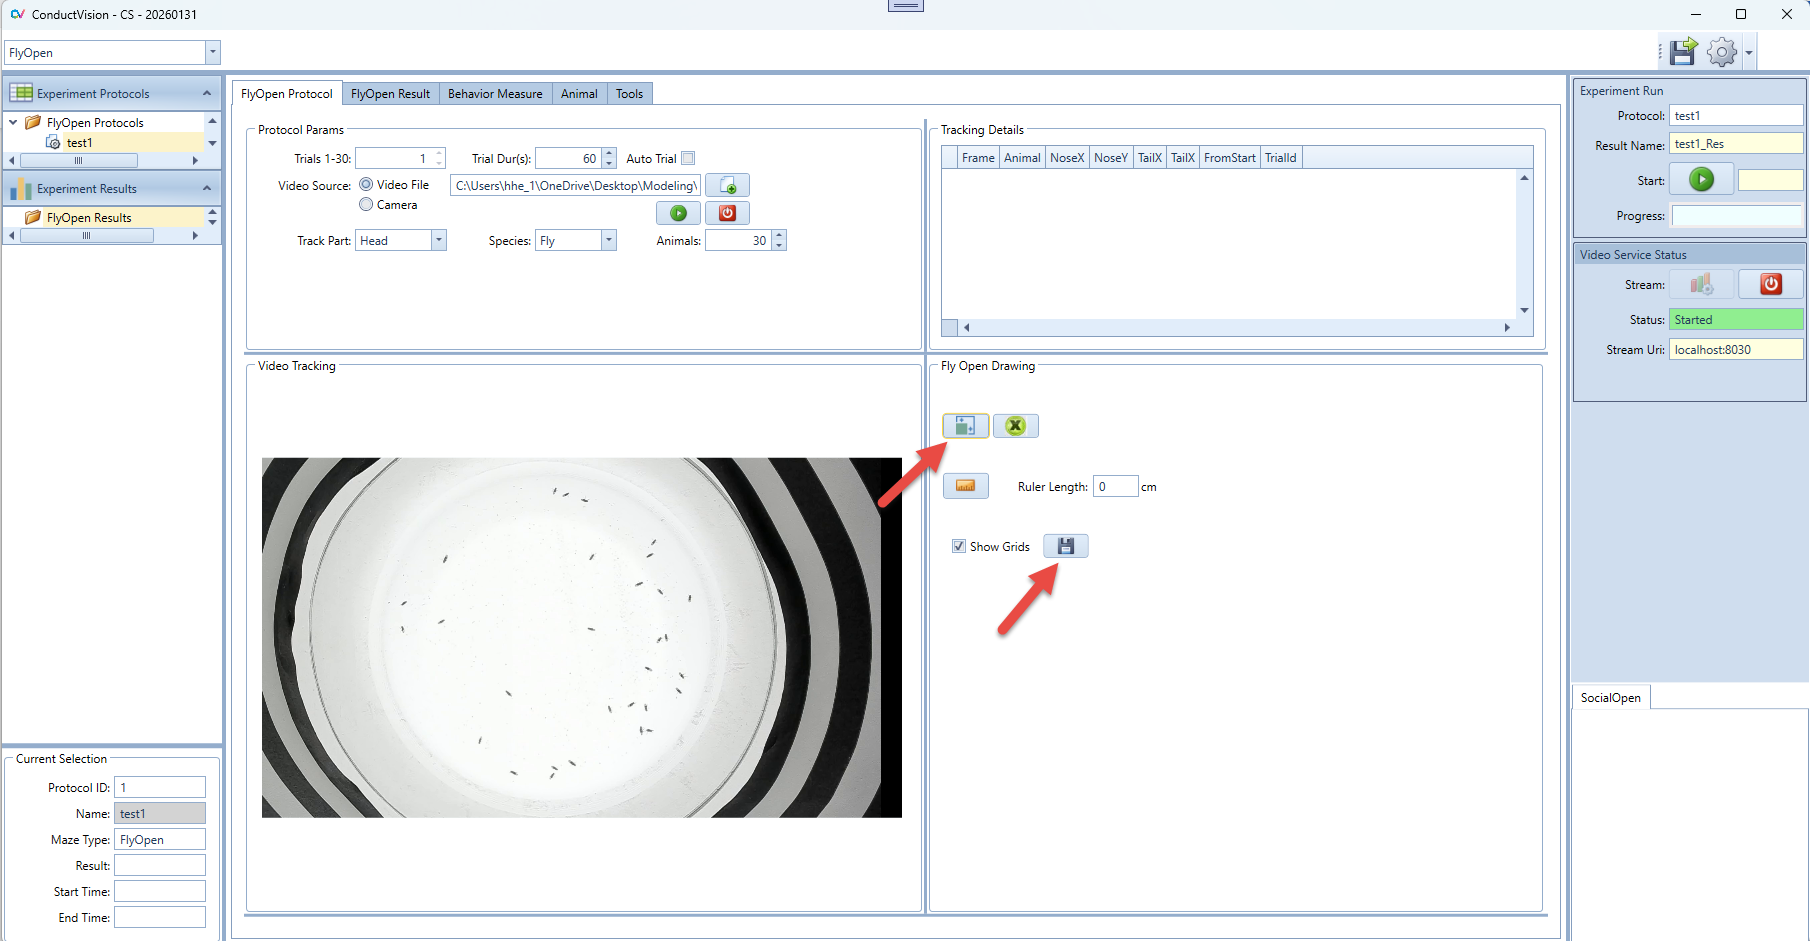
4.3.2 Drawing Rectangle
- Click button in the FlyOpen Drawing group to enable the drawing mode.
- On the maze, select the point on the left upper corner and drag to the right bottom inside the maze
- After the drawing, click Save button.
- The rectangle size should be just large enough to cover the maze and animal.
4.4 Ruler
4.4.1 Distance Measurement
In software, the camera image distance is defined as pixels. We are interested in reporting distance meters like cm. So, we need to know the pixels distance on screen maps to meter distance cm.
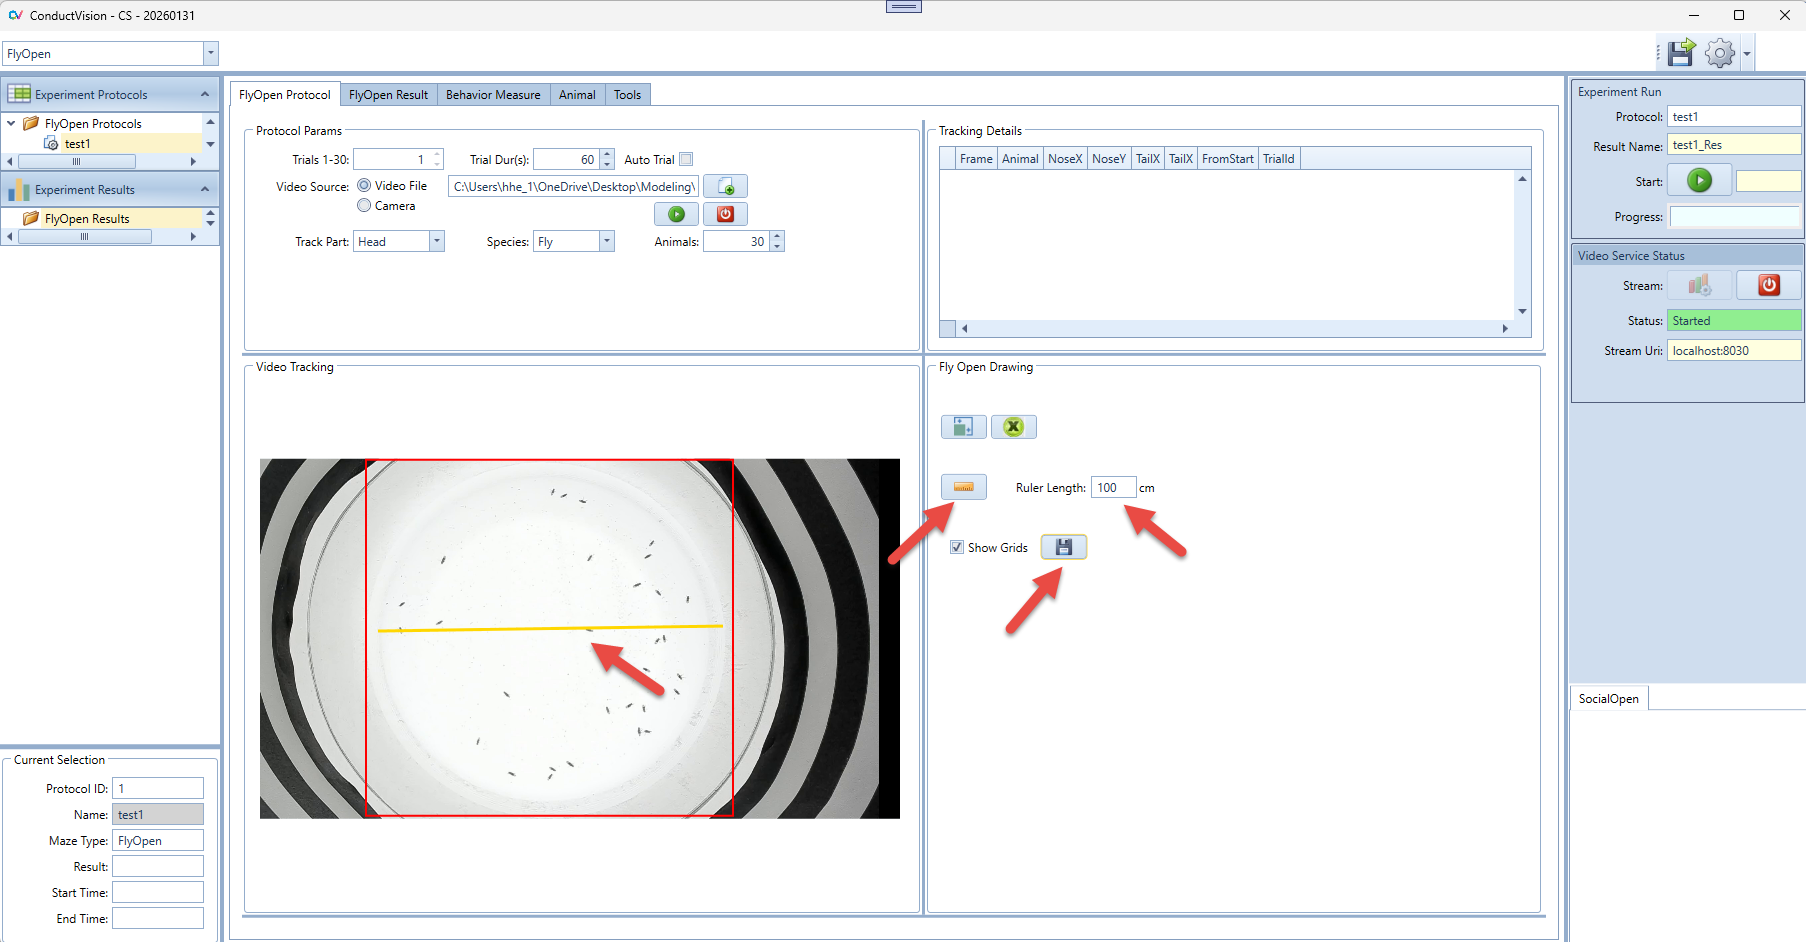
4.4.2 Ruler Drawing
- Click on the Show Ruler button, and a line appears on the maze
- Draw the ends of the line to two end points of the maze
- Enter the real distance in the field. For example, the dimension of the standard open field maze from Maze Engineers is 40 x 40 cm so you enter 40.
- Click Save button to save the data.
- Click on the Ruler button again to exit the ruler drawing mode.
5. Experiment Run
To execute an experiment, select the protocol under "Protocols" on the left navigation panel and double click on it. Make sure the service stream is connected.
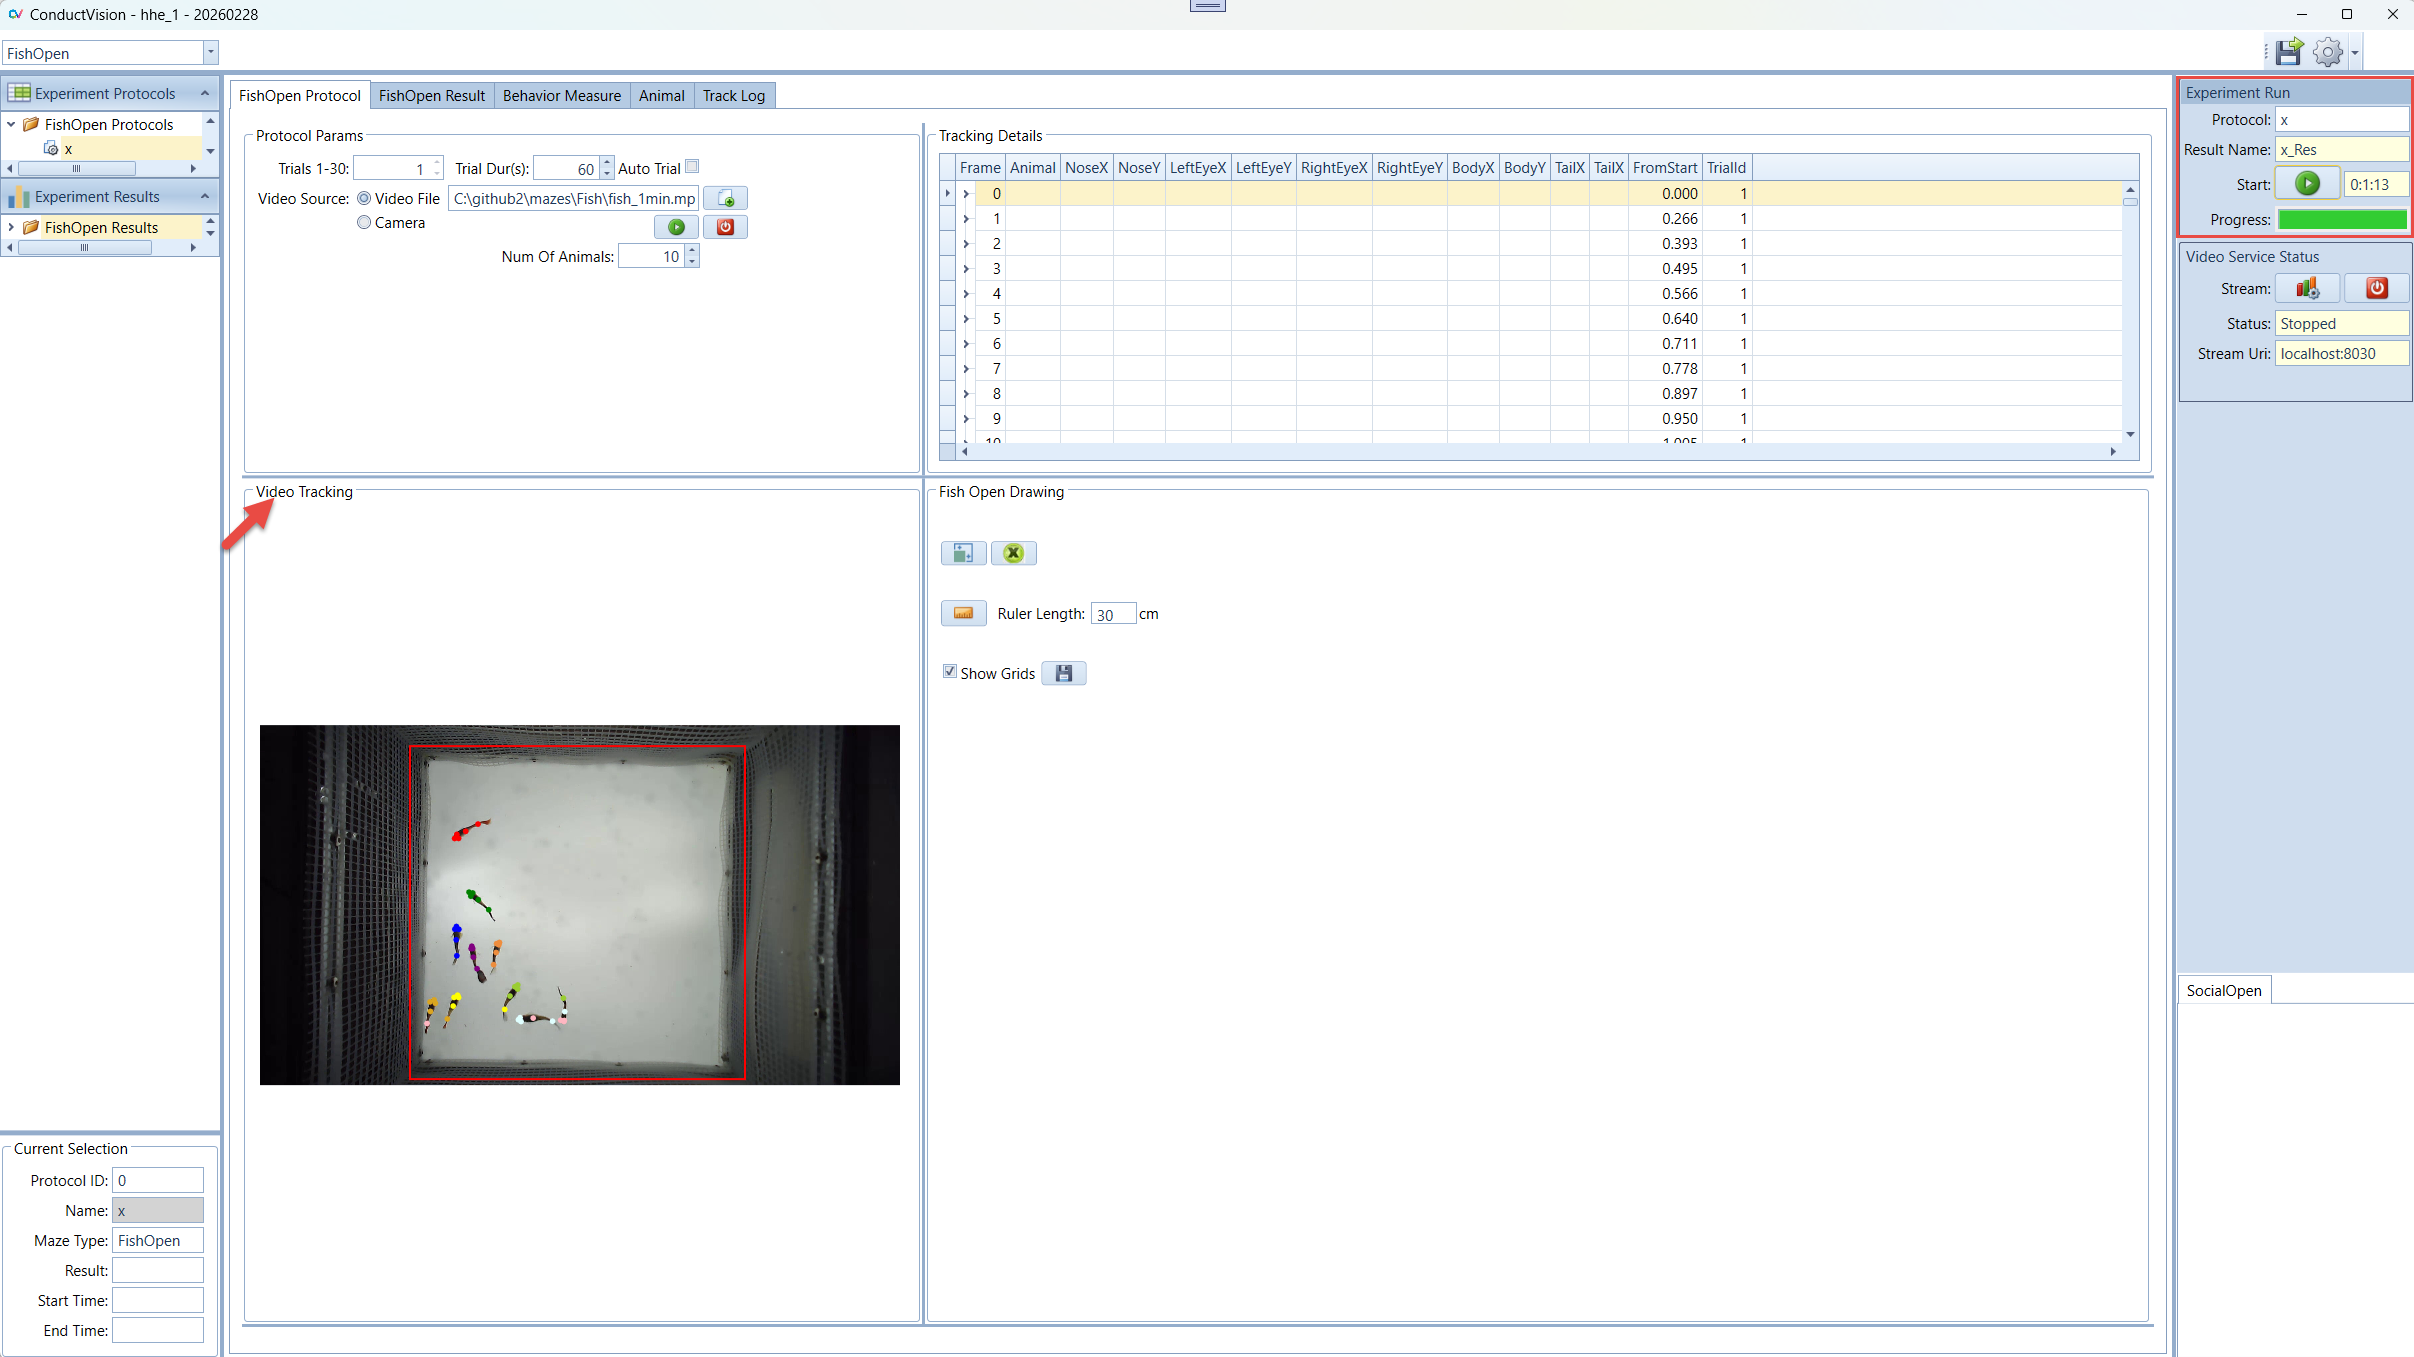
5.1 Run Experiment
Enter a name for the experiment run and click Start button. This will set system in the running state.
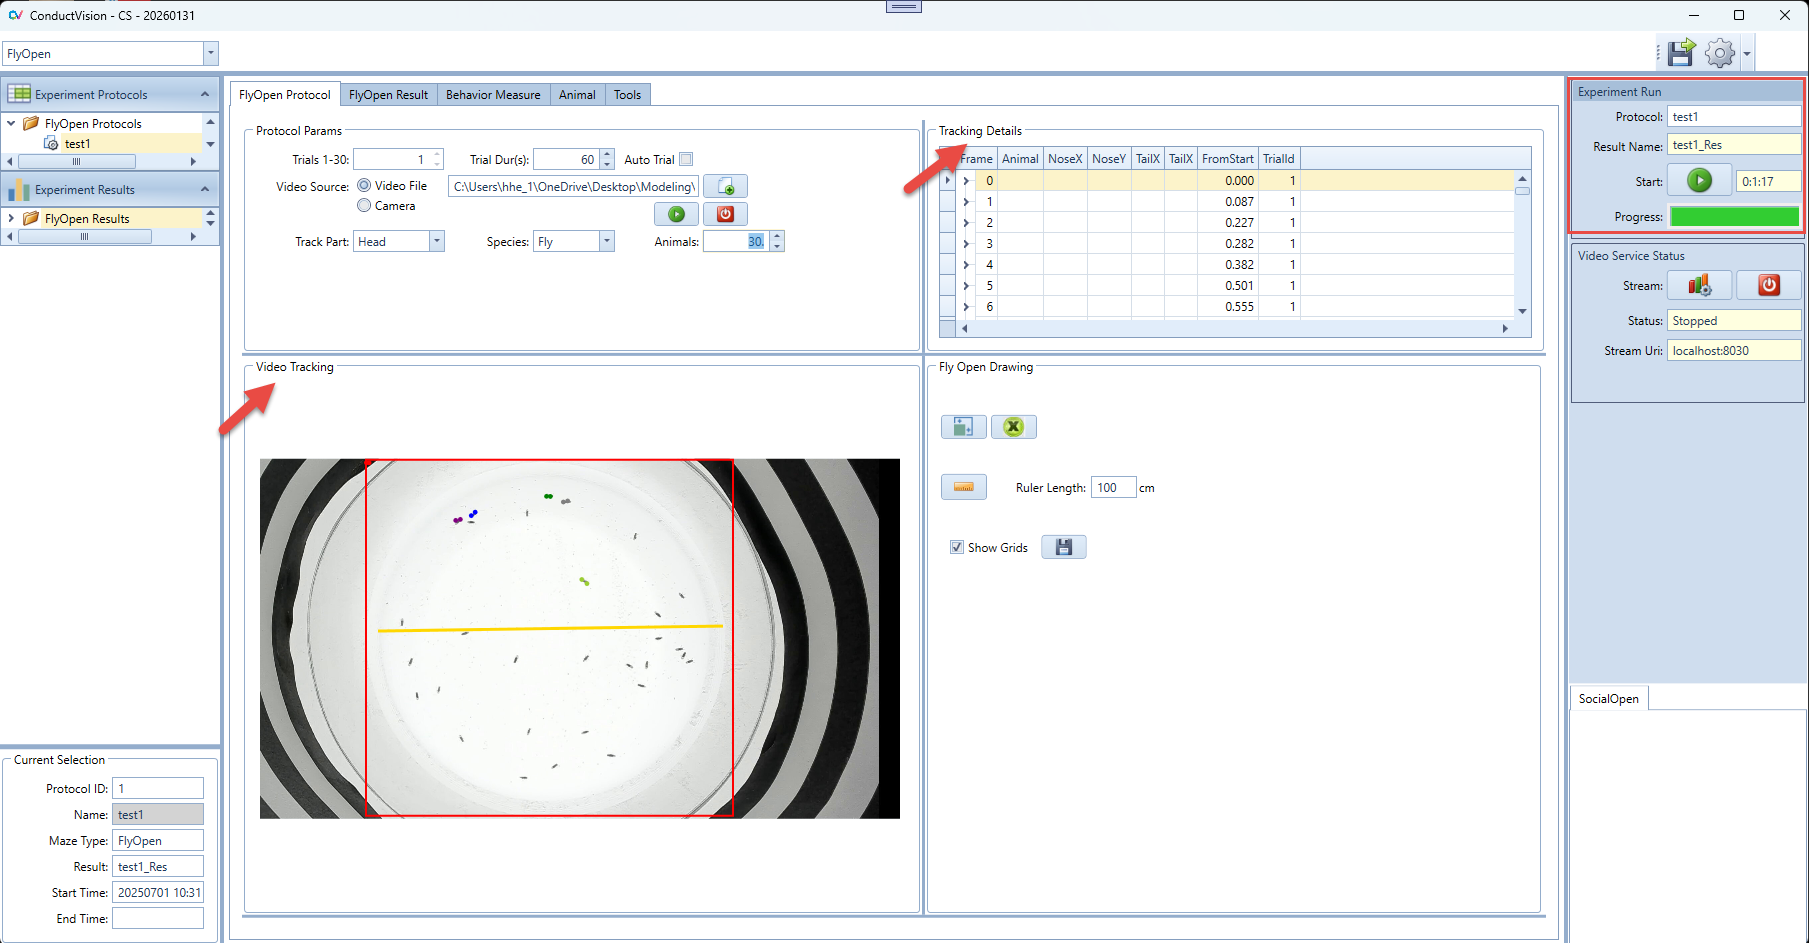
When the start button is clicked, the state of button becomes Stop. The user can click on a stop button to stop the session run.
The experiment will stop when total time reaches, or all trials are completed, or the user stops it.
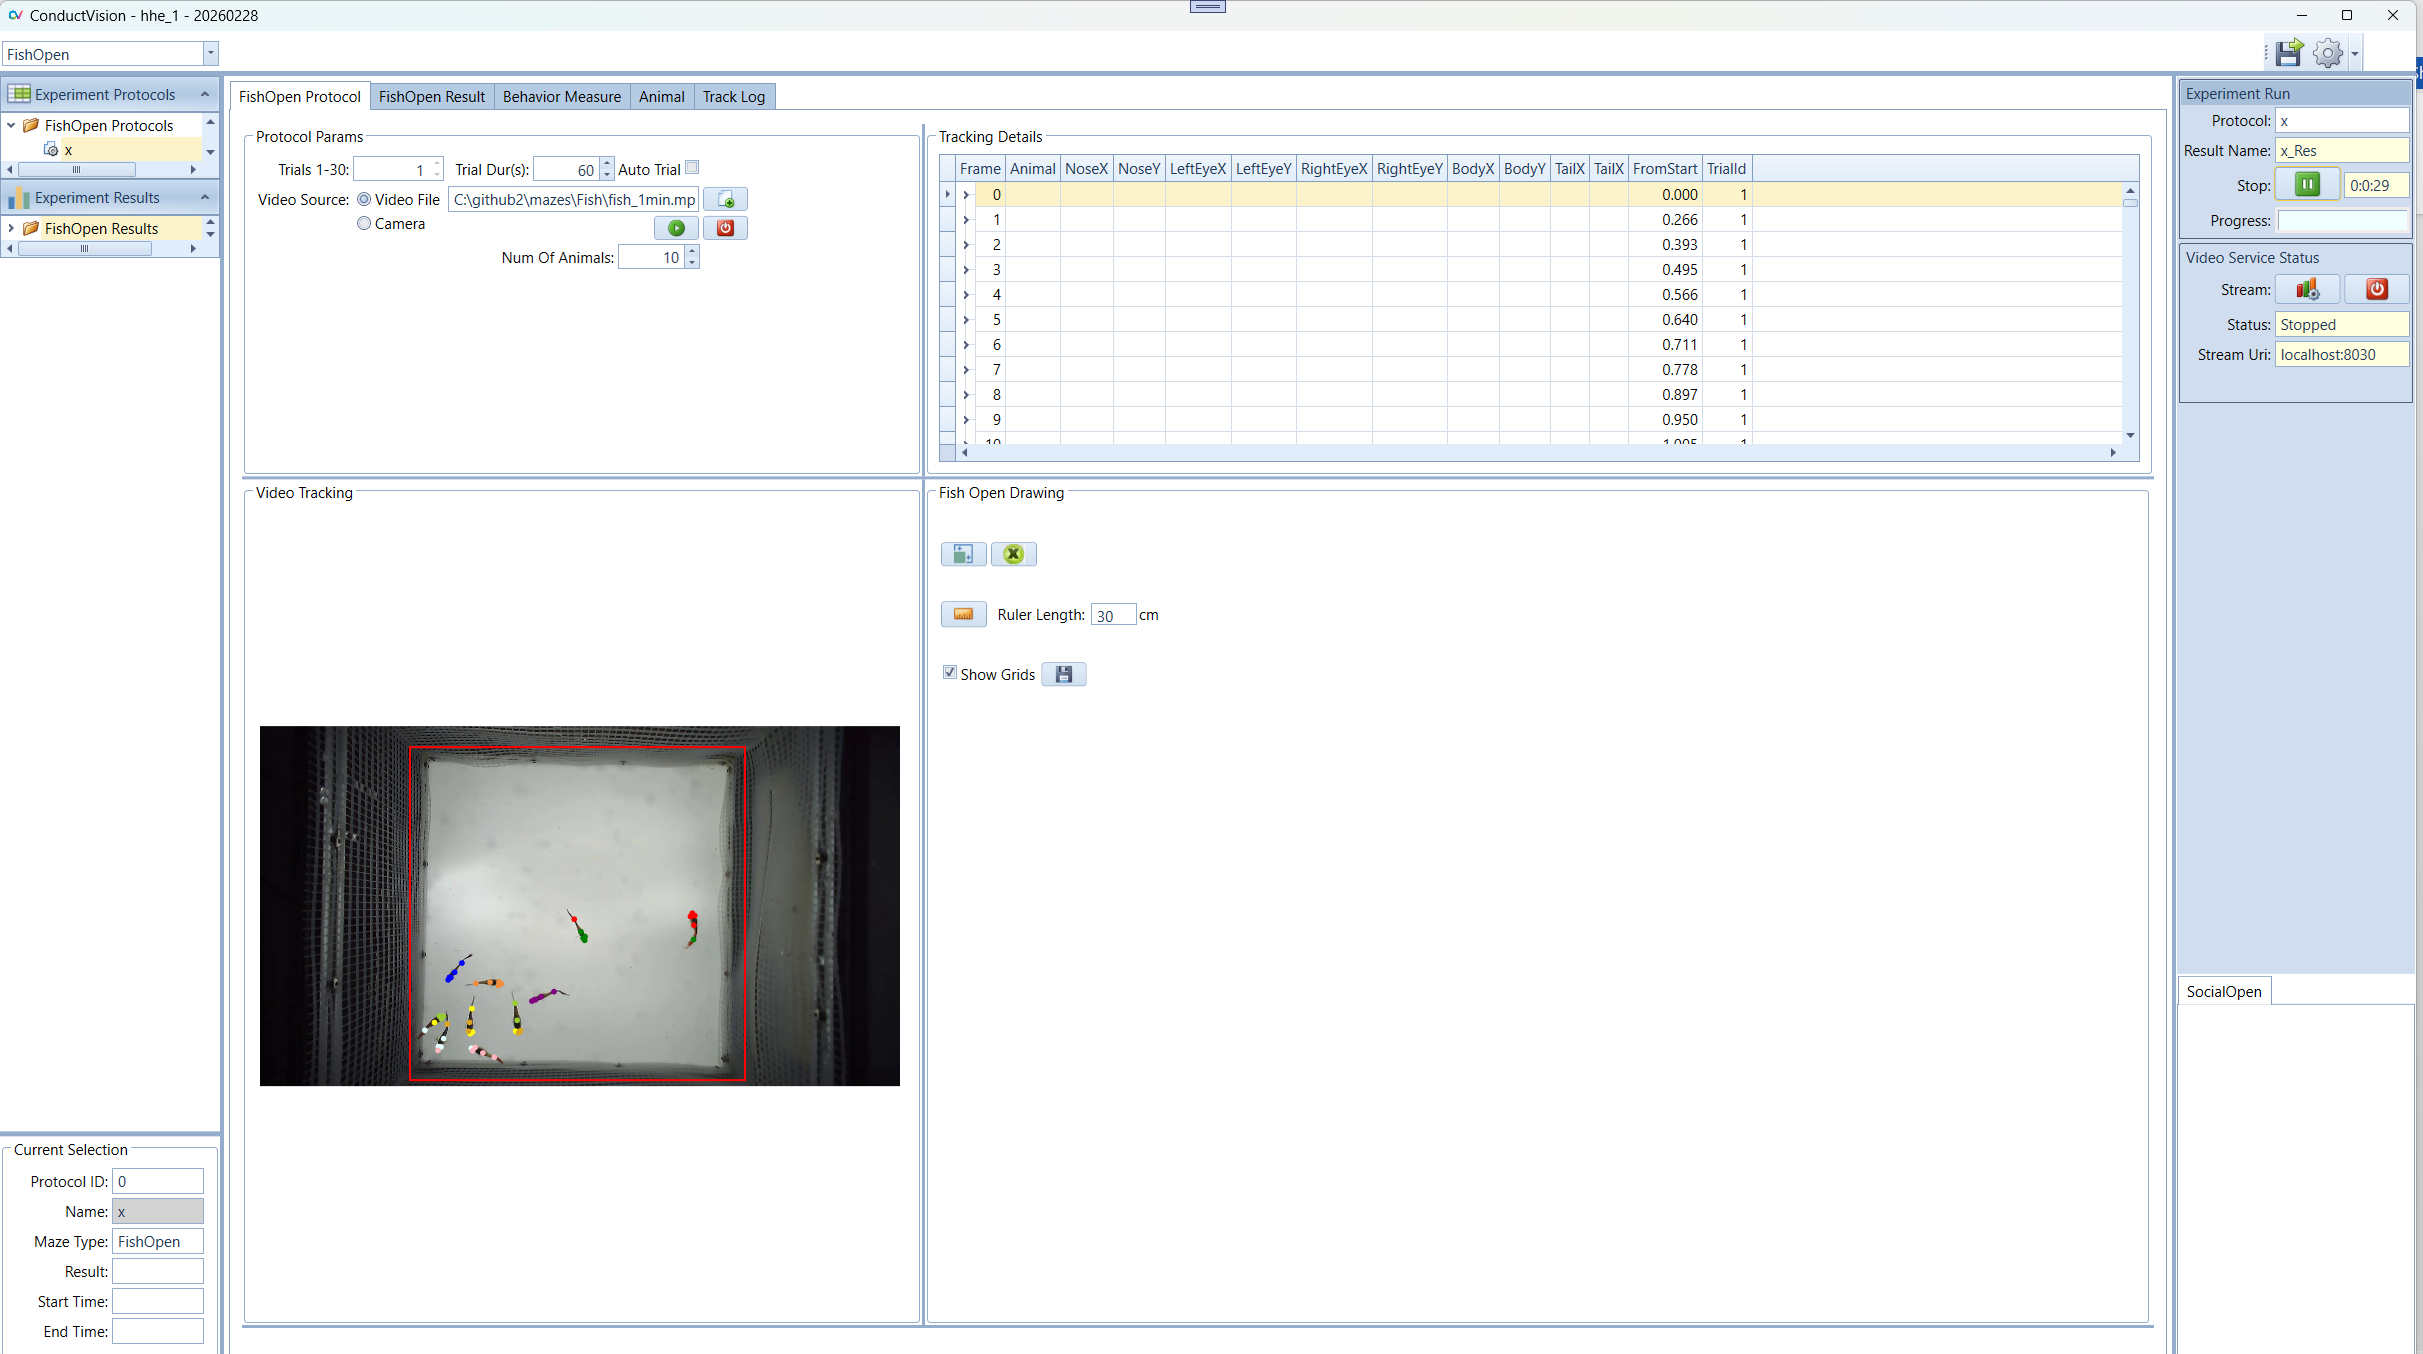
In the Video Tracking panel, the animal moves are tracked.
In the Tracking Details panel, the track details are recorded. The data grid only should be the latest trial. When a trial is completed, the tracking data is saved.
5.2 Tracking Data
The tracking data on the Protocol tab is organized in a tree structure. For example, if the number of animals is 10, for each frame, there are ten rows, each for one Fly and a parent row. To expand the data grid, double click on the left keyboard mouse; to collapse the data grid, double click on the right keyboard mouse.
5.3 Result Tables
Select the result from the left Experiment Result. The results are shown on the Result tab. There are five panels to show the results.
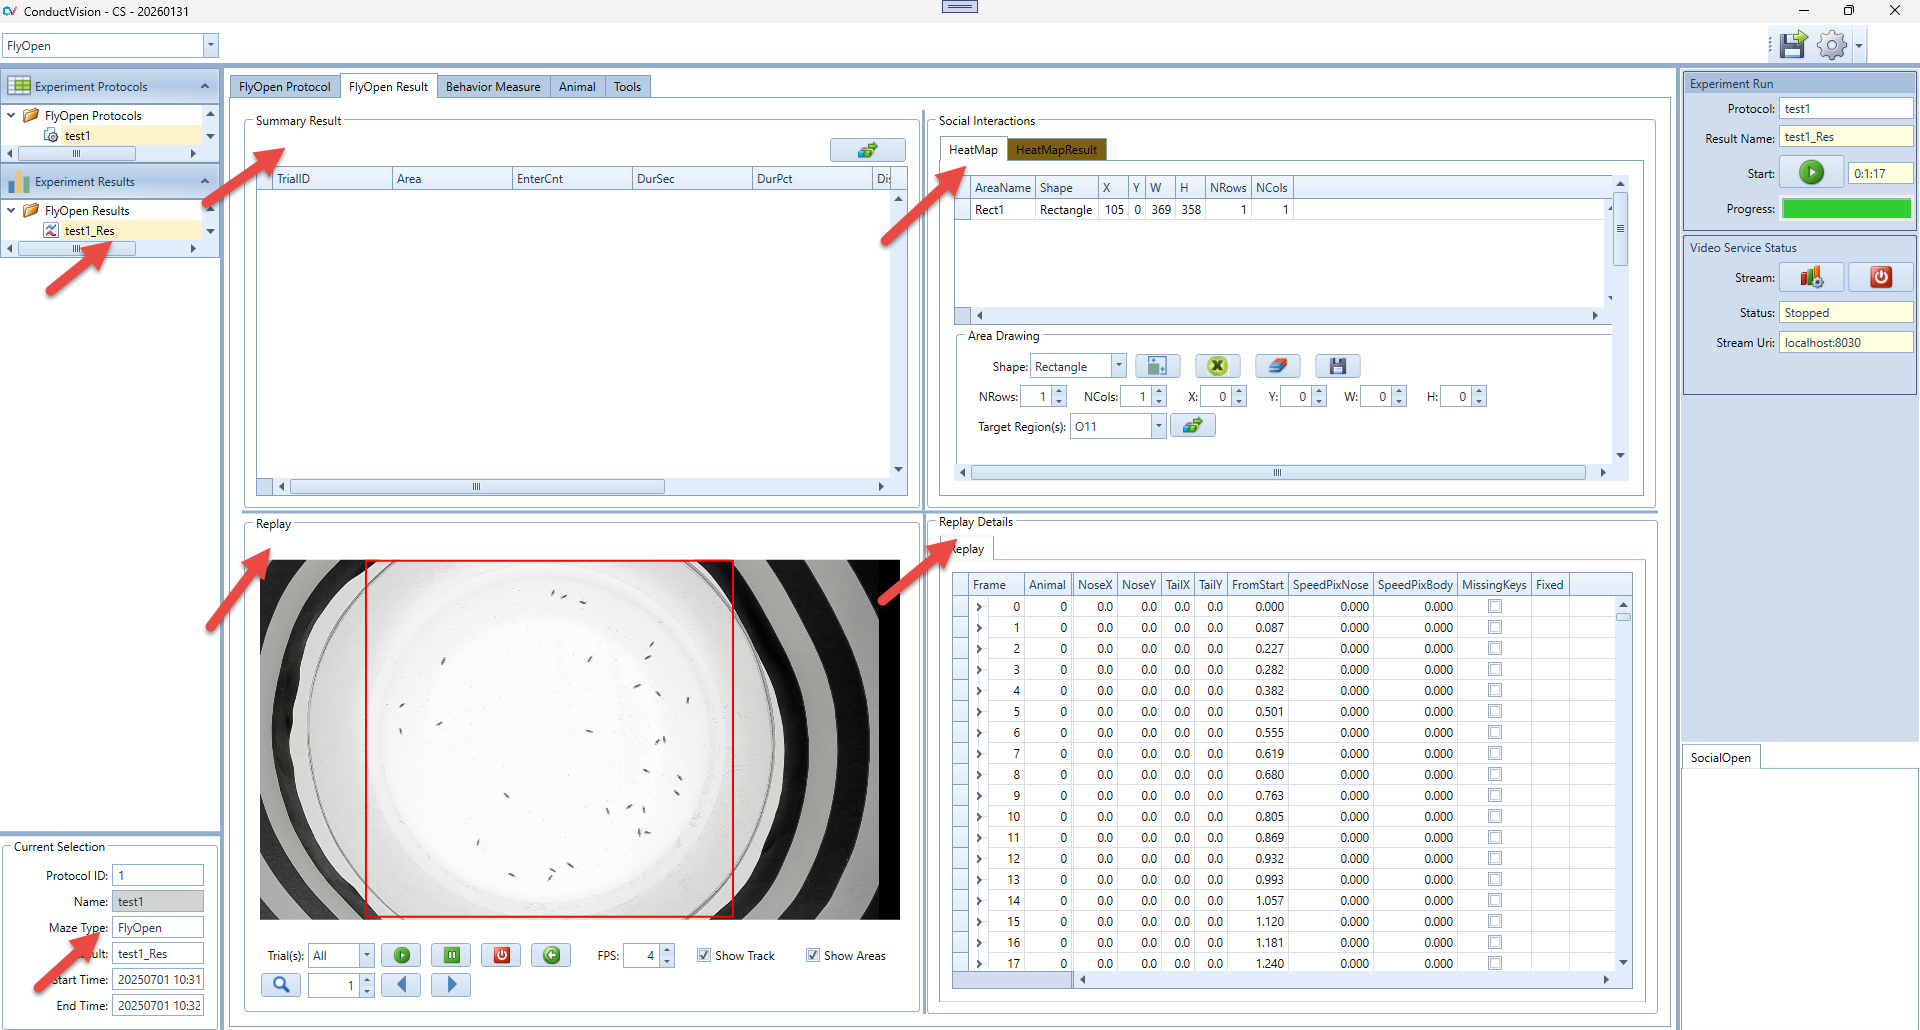
Replay Details: it contains all tracking data of the protocol run.
Replay: it allows user to replay the video at a user defined speed or frame by frame
HeatMap: Draw four different shapes of areas, including: Grid rectangle, Evenly divided oval, Concentric rectangle, Concentric oval. Define the target area and analyze the animal's movement from non-targeted areas to the target area.
Summary Result: Calculate and display the summary of social interaction behaviors.
Current Selection: display the protocol run start and end timestamps.
5.4 Tips of Grid Data View
In the application, the UI Tree Grids are used. To expand the tree data grid, double click on the left keyboard mouse; to collapse the data grid, double click on the right keyboard mouse.
5.5 Video Tracking Replay
5.5.1 Video Replay
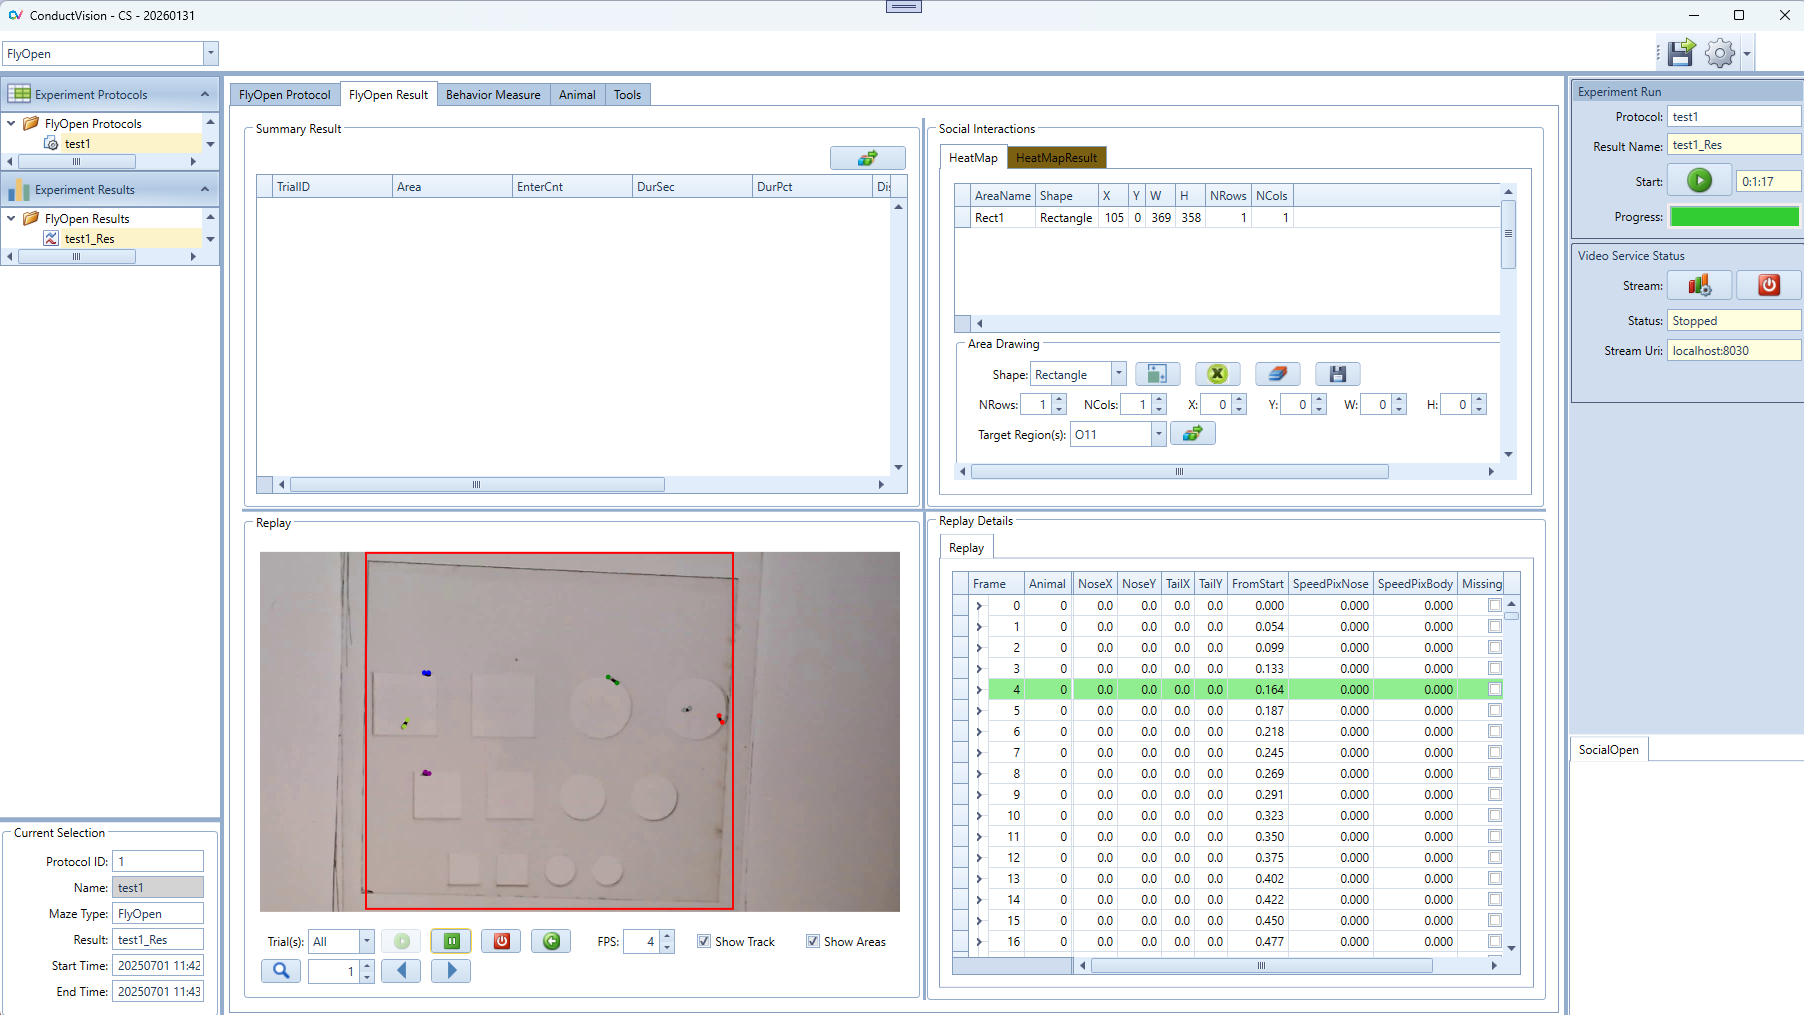
The panel allows the user to replay the video at a user's preferred speed
The panel can also let the user search for a certain frame and navigate forward and backward frame by frame.
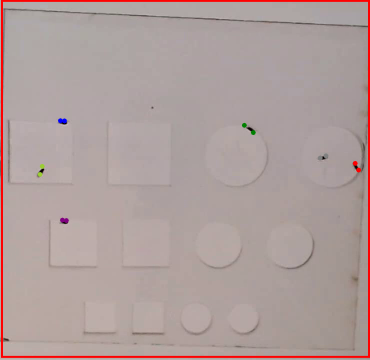
The tracking key point data is highlighted along with the move of the frames.
This gives users the tool to review videos and closely examine animal behaviors.
5.5.2 Display Properties
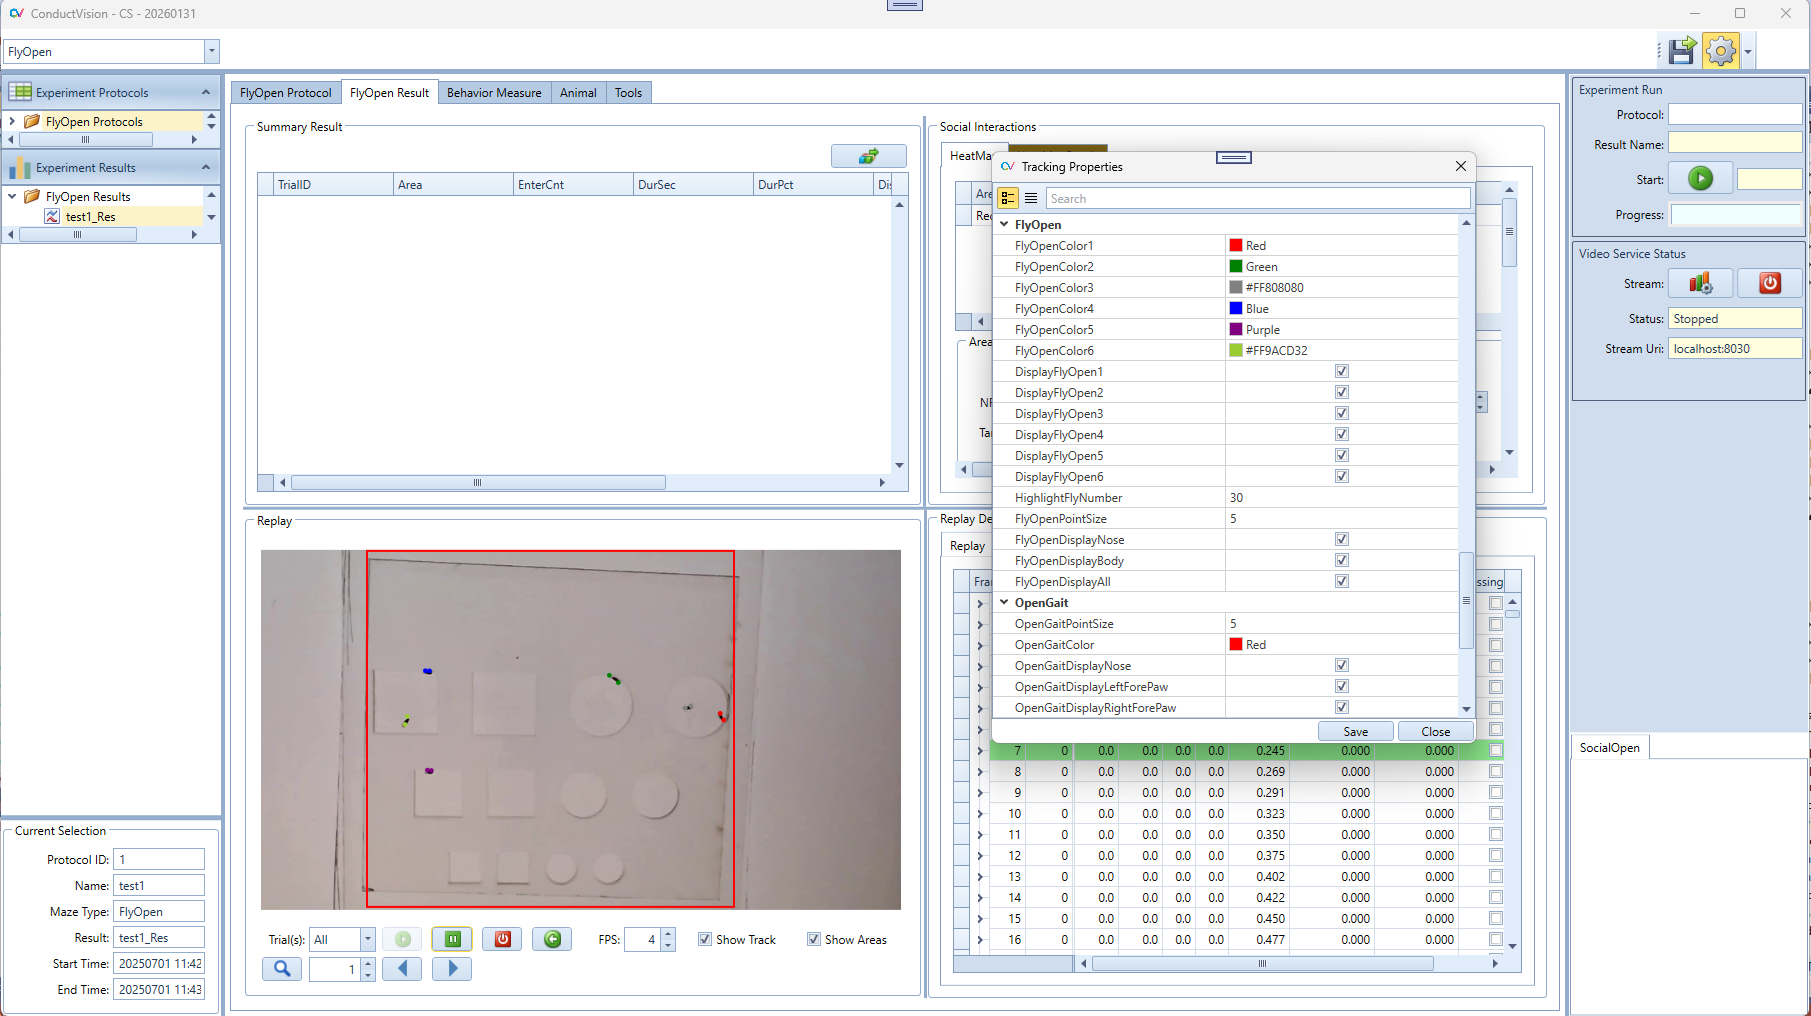
The display colors, size, and body-part selections can be configured in the Properties dialog. A specific fly can be highlighted using HighlightFlyNumber; the highlighted fly's color will match the color used for fly number 2.
6. Social Interaction Behavior Analysis
6.1 Key Points
Conduct Vision is an AI based video tracking system. Key points are manually annotated on the animals' bodies to create a labeled dataset for training. A pre-trained model is then fine-tuned on this dataset to adapt to the specific animal species and experimental conditions. The model predicts the 2D coordinates of key points (body parts) in each frame by generating heatmaps, where each heatmap represents the likelihood of a specific key point being at each pixel location.
Two key points are chosen: nose, and tail.
6.2 Heat Map Definitions

6.2.1 View or Select an Existing Area
1. View or Select an Existing Area
- The table at the top lists all defined areas with the following fields: AreaName, Shape, X, Y, W, H, NRows, NCols.
- Click any row in the table to select an area. When selected, the area's parameters will automatically populate into the fields below:
- NRows, NCols – Grid layout information.
- X, Y – Top-left corner position.
- W, H – Width and height of the area.
- You can now edit these values manually to adjust the size or position of the selected area.

2. Create a New Drawing Area
- In the "Shape" dropdown, select the desired shape (e.g., Rectangle, Oval, Concentric Oval, Concentric Rectangle).
- Important: You must remove all existing areas before creating new ones. Use the "Clear All" button to remove all drawn areas from the canvas.
- Once the canvas is cleared, click the Draw Icon to add a default shape to the canvas

3. Modify Area Parameters
- Adjust the values for:
- NRows / NCols (only for grid-type areas).
- X / Y: Top-left corner position.
- W / H: Width and height.
- Make sure to click the Save button after editing to apply and store your changes in the heatmap protocol.
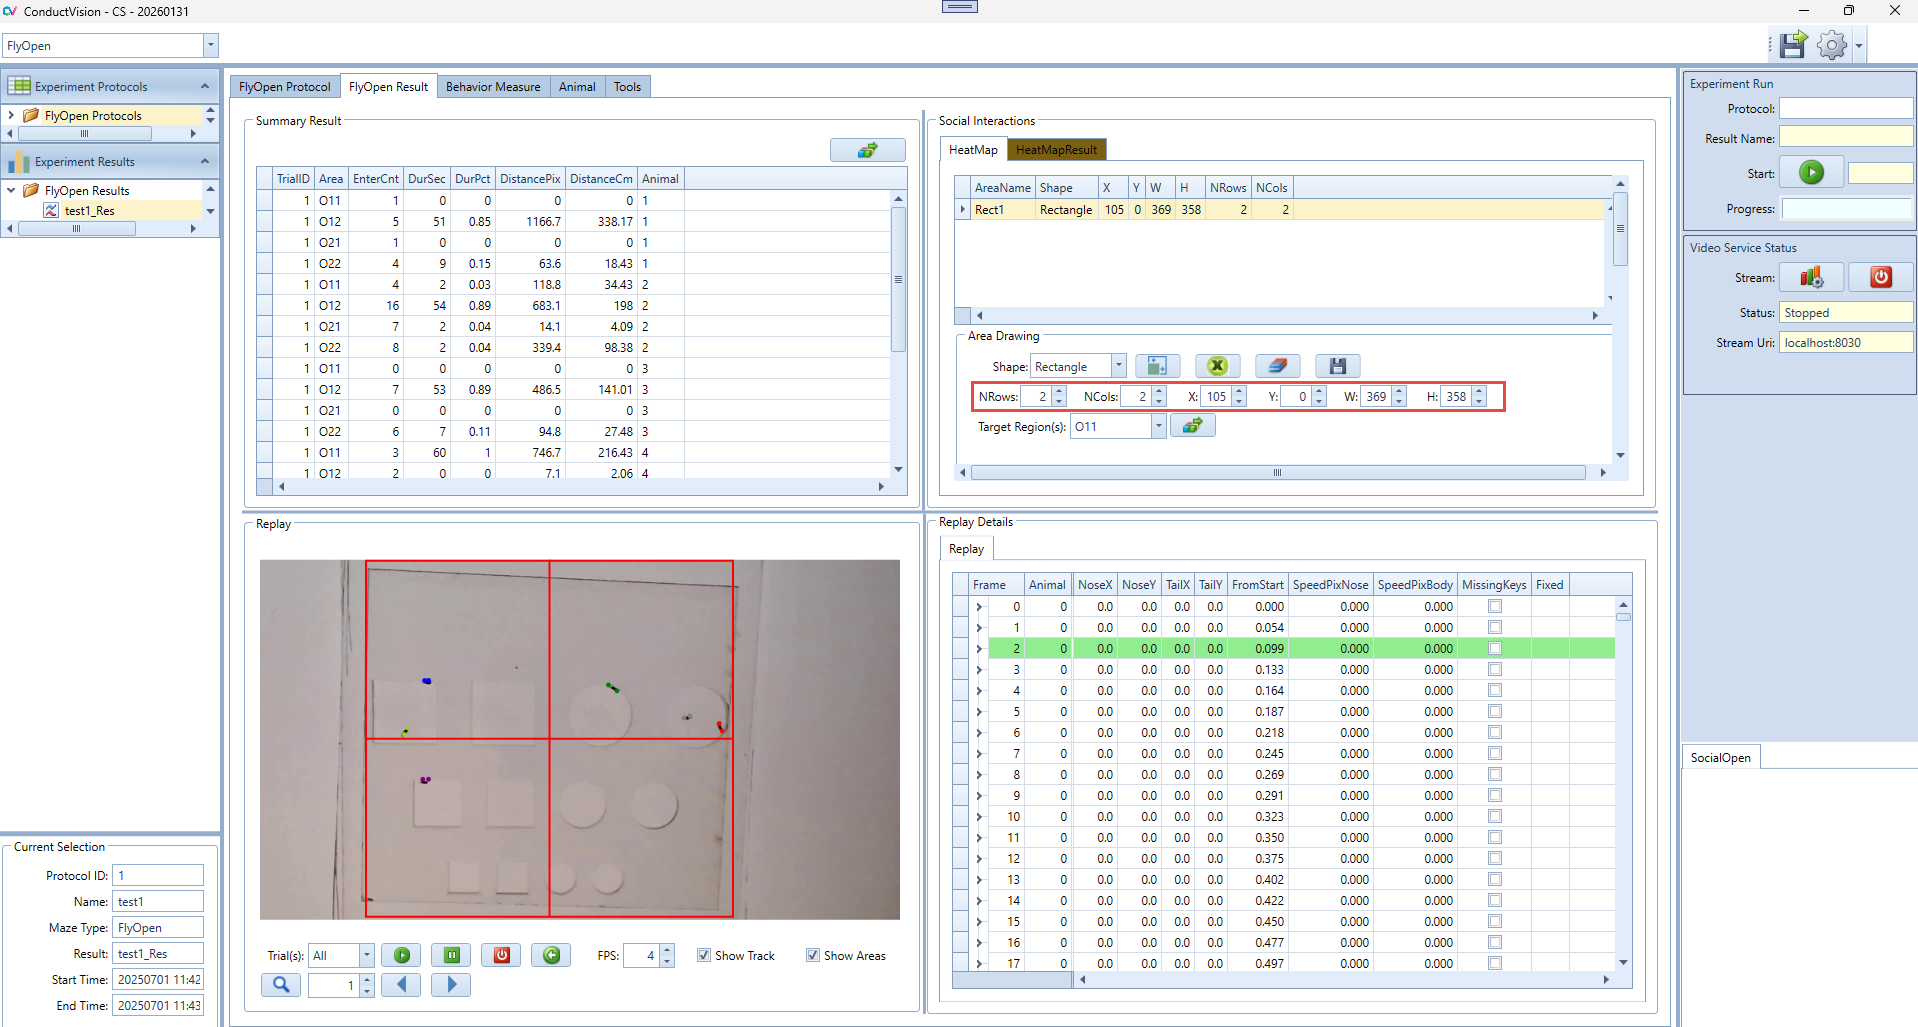
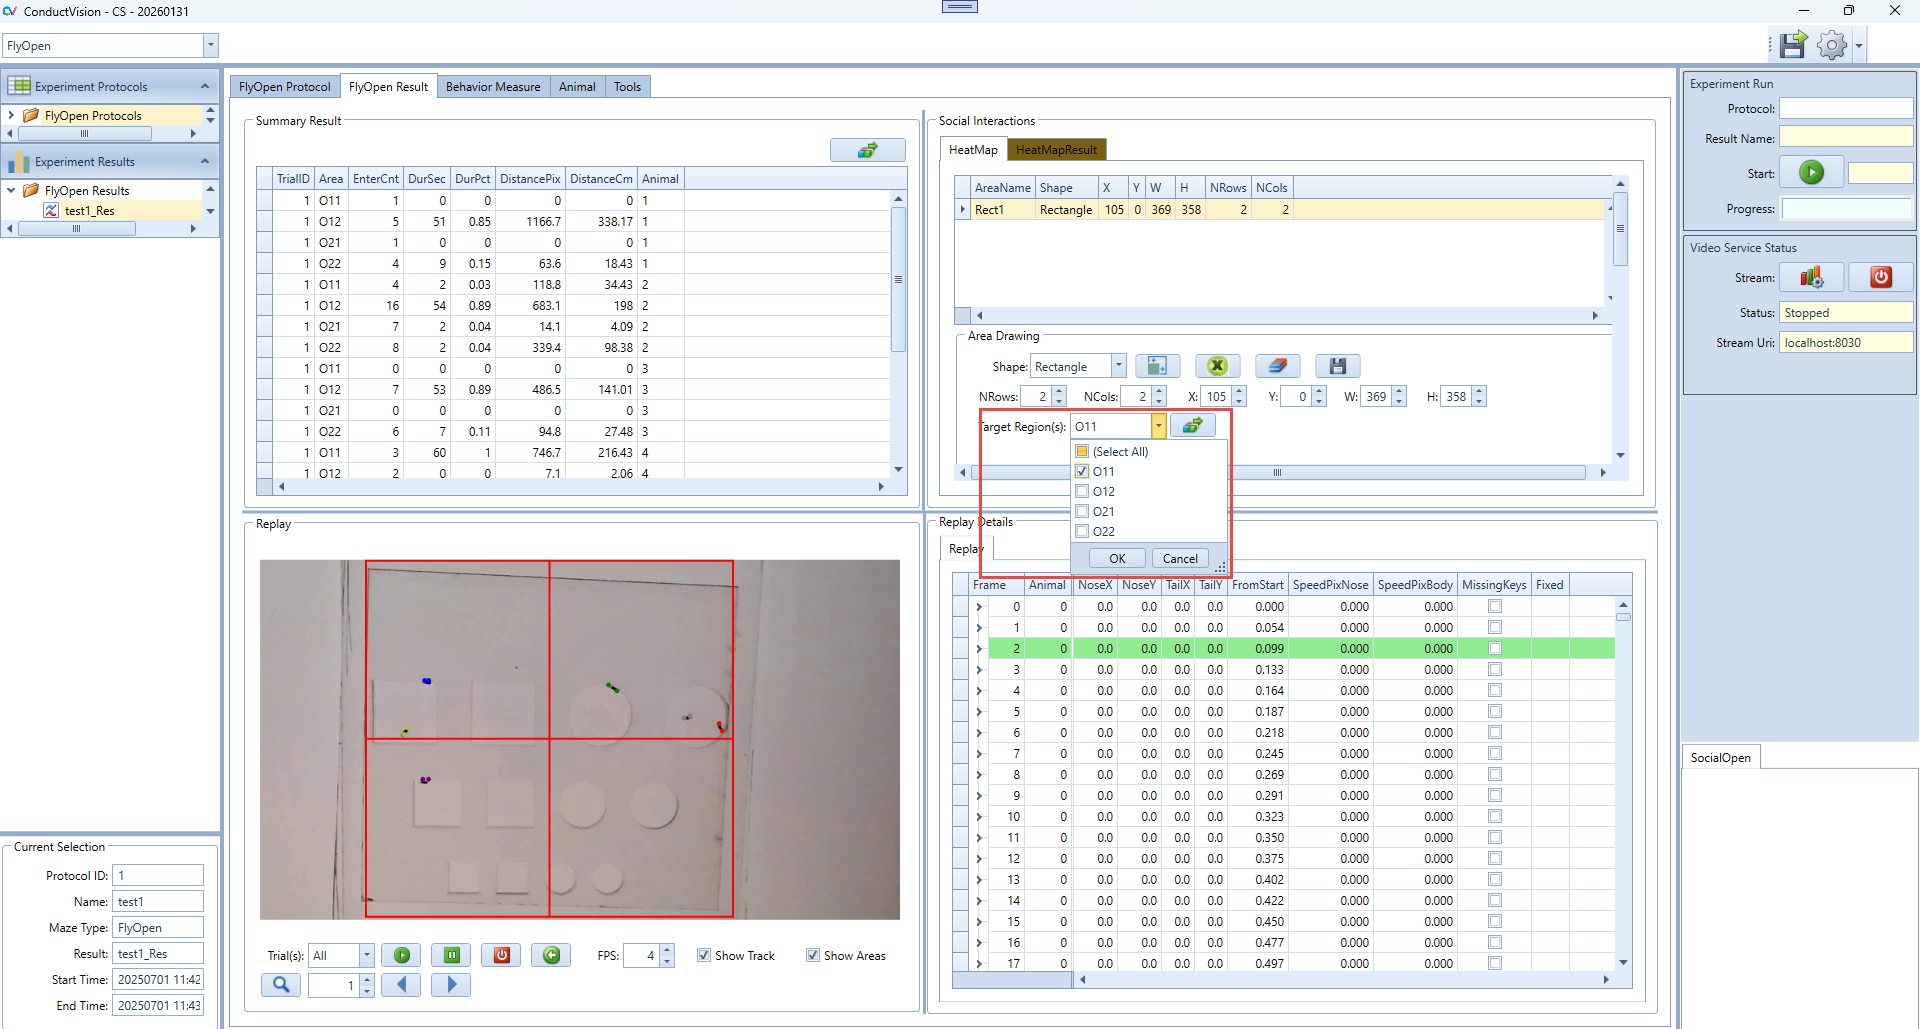
4. Define Target Region(s)
- Use the "Target Region(s)" dropdown to select one or more areas that will be considered target zones for transition tracking.
- This is a multi-select dropdown.
- Note: If you're using a Grid-type rectangle, the software will automatically generate pre-named areas based on row and column count. For example, if NRows = 2 and NCols = 2, the area names will be: O11, O12, O21, O22.
5. Run Heatmap Analysis
- Click Calc Summary to calculate heatmap metrics based on your defined and selected areas.

6.2.2 HeatMapResult Panel Instructions
The HeatMapResult tab displays the results of the heatmap analysis for each animal. It provides a summary of key behavioral metrics based on movements into defined target areas.
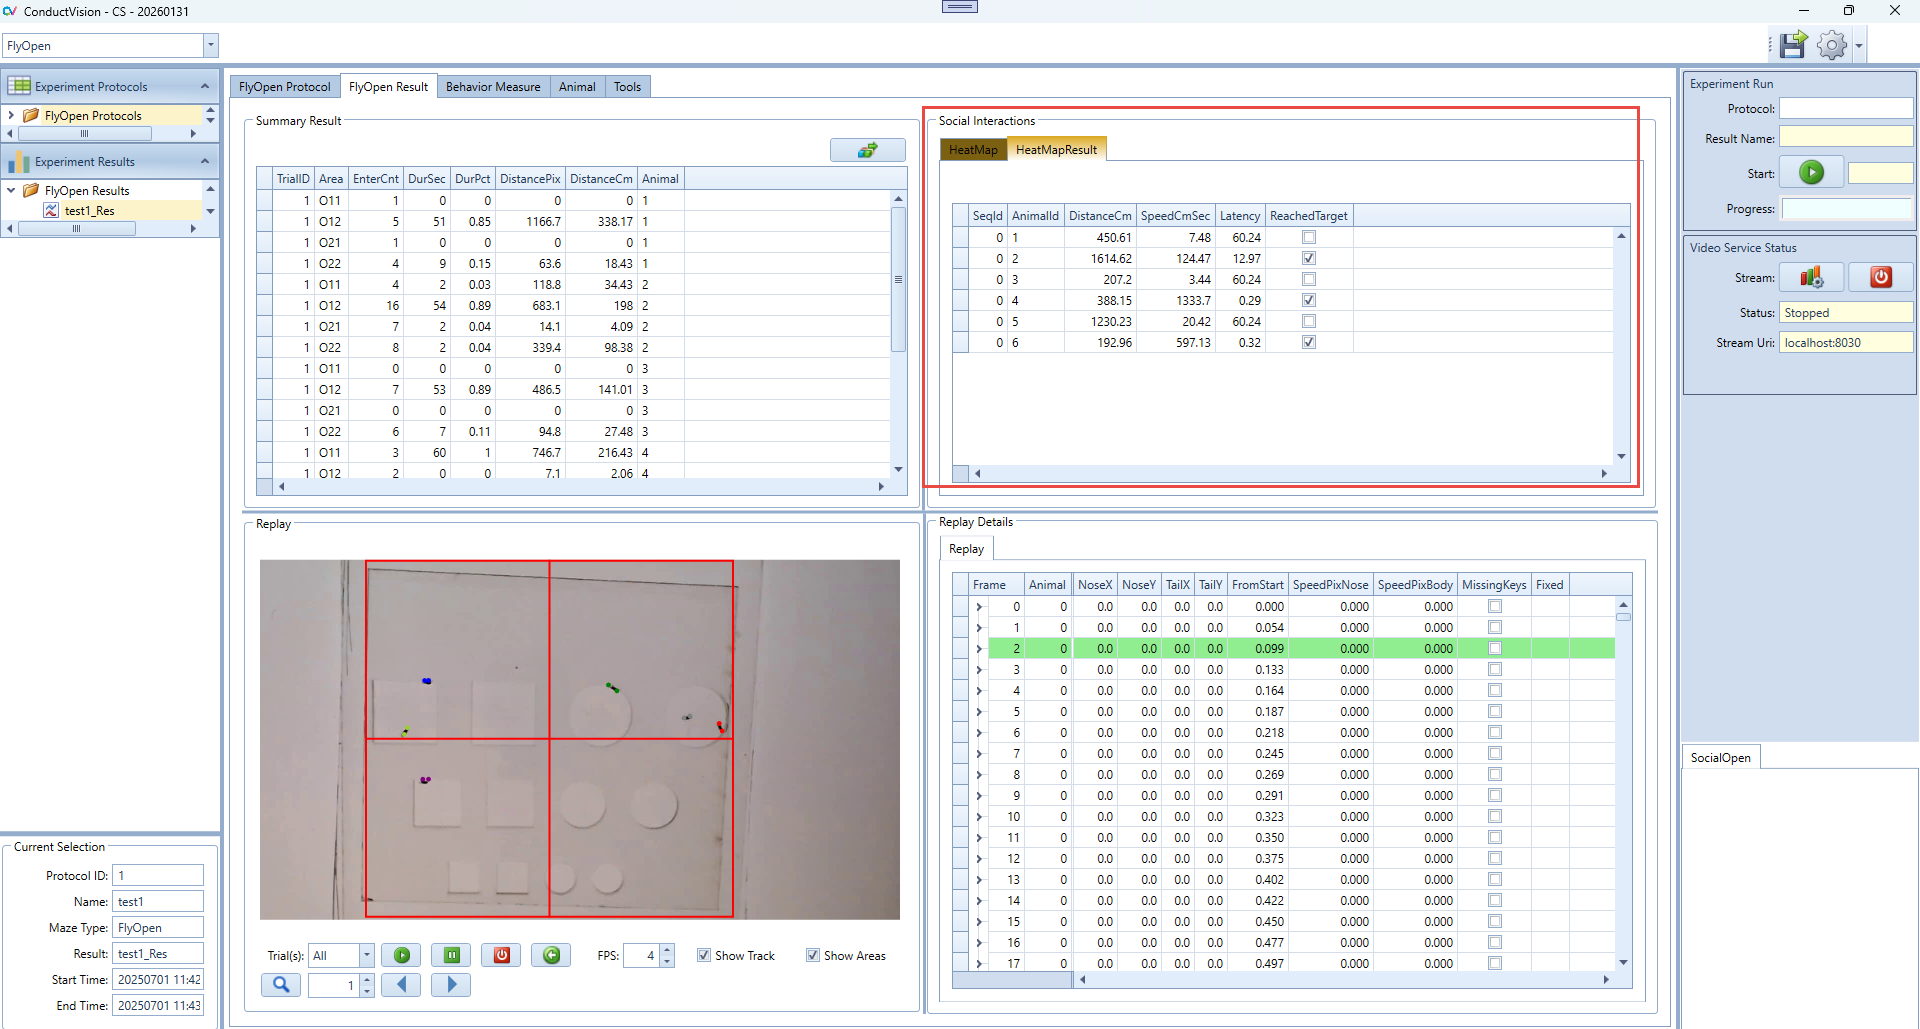
- After you run a heatmap analysis from the main HeatMap tab, the result will appear here.
- Each row represents one trial or subject and summarizes the behavioral performance.
- Use DistanceCm and SpeedCmSec to assess general activity level.
- Use Latency and ReachedTarget to evaluate target-seeking behavior
- To recalculate or update values, return to the HeatMap tab and click Calc Summary again.
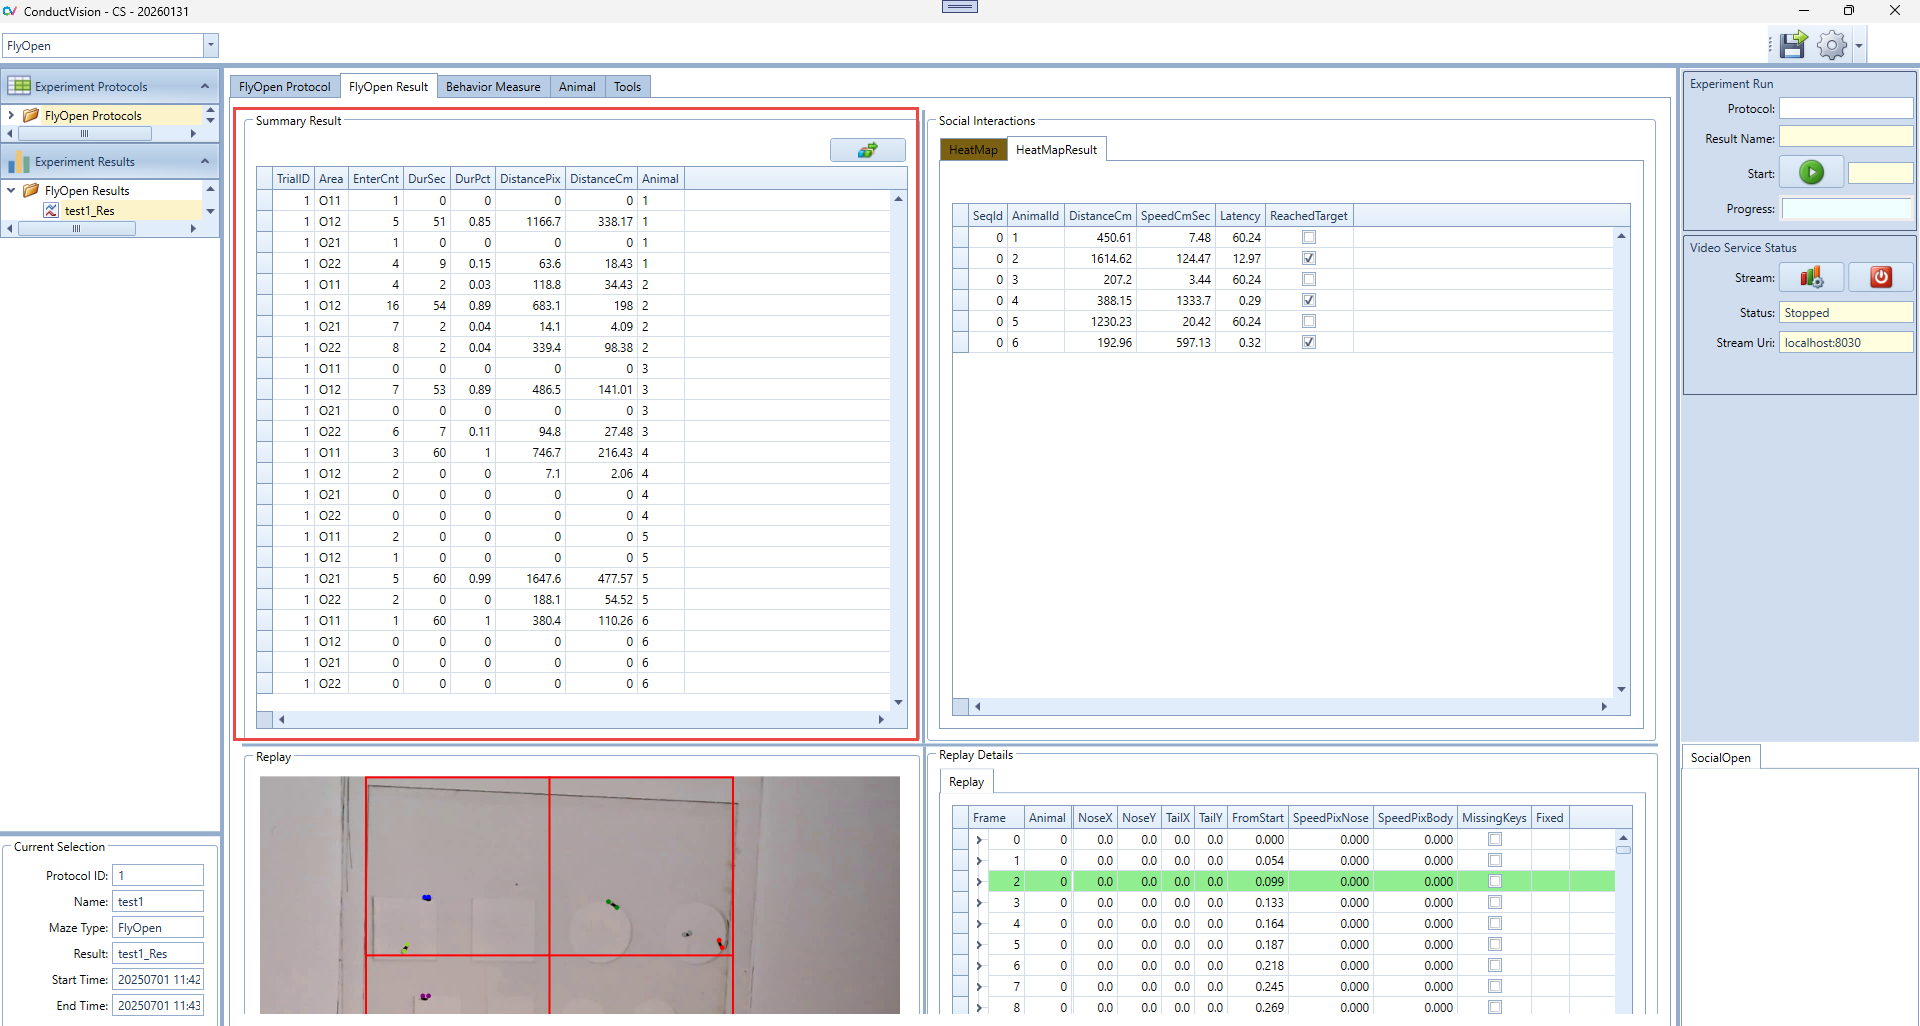
6.2.3 Summary Panel Instructions
Generate Activity Summary
- After defining the target areas in the HeatMap panel:
- Click the Calc Summary button to generate detailed activity metrics.
- The results will appear in the Grid Summary Table, where each row corresponds to an animal's activity within a specific grid or area.
- This process must be repeated if target regions are changed or new areas are drawn.
7. Marker-less Multi-Animal Tracking
7.1 Marker-less Tracking Technologies
In multi-animal tracking scenarios, individual animals are identified and tracked independently, even in cases of overlapping or occlusions. This is achieved by incorporating identity tracking mechanisms and enforcing spatial constraints to maintain consistent tracking across frames. There are two steps of data capture and processing.
First, animal key point estimation is performed using Fully Convolutional Networks (FCNs) based on deep neural network architectures such as YOLO (You Only Look Once) and ResNets (Residual Networks). Initially, key points are manually annotated on the animals' bodies to create a labeled dataset for training. A pre-trained model is then fine-tuned on this dataset to adapt to the specific animal species and experimental conditions. The model predicts the 2D coordinates of key points (body parts) in each frame by generating heatmaps, where each heatmap represents the likelihood of a specific key point being at each pixel location.
Secondly, to maintain consistent identities across frames, algorithms such as the Hungarian algorithm for bipartite graph matching or Kalman filtering are employed. These algorithms leverage spatial proximity, motion coherence, and temporal information to associate detected key points with their respective animals over time.
On the software, the tracking data presented on the protocol tab during the tracking is a result of step 1 so there are some cross points among animals. The step 1 tracking is displayed so that the user can view the progress of the video tracking. The final tracking data on the result tab is the result of the final (two steps) process so that the animals are identified consistently across frames. The two step results are used for social interaction analysis.
7.2 Step 1 Tracking Data
This is for users to view tracking progress.
7.3 Final Tracking Data
The final tracking data is consistent across frames and used for social interaction behavior analysis.
7.4 Tracking Accuracy
The trained model is based on fine-tuned on this dataset to adapt to the specific animal species and experimental conditions.
To create a trained model, key points are manually annotated on the animals' bodies to create a labeled dataset for training. The dataset is constructed using wide ranges of videos that have mazes colors (white, black, grey and blue), animal colors (white and black) and light conditions (normal and IR).
It is normal that the labs have different recording environments (mazes, animals and lighting conditions). If the tracking accuracy is low, we have recommendations:
- Improve the video recording quality. Our sample videos can show the expected quality and results
- The lab videos can be added to the trained model to achieve high tracking accuracy.
8. Export Data
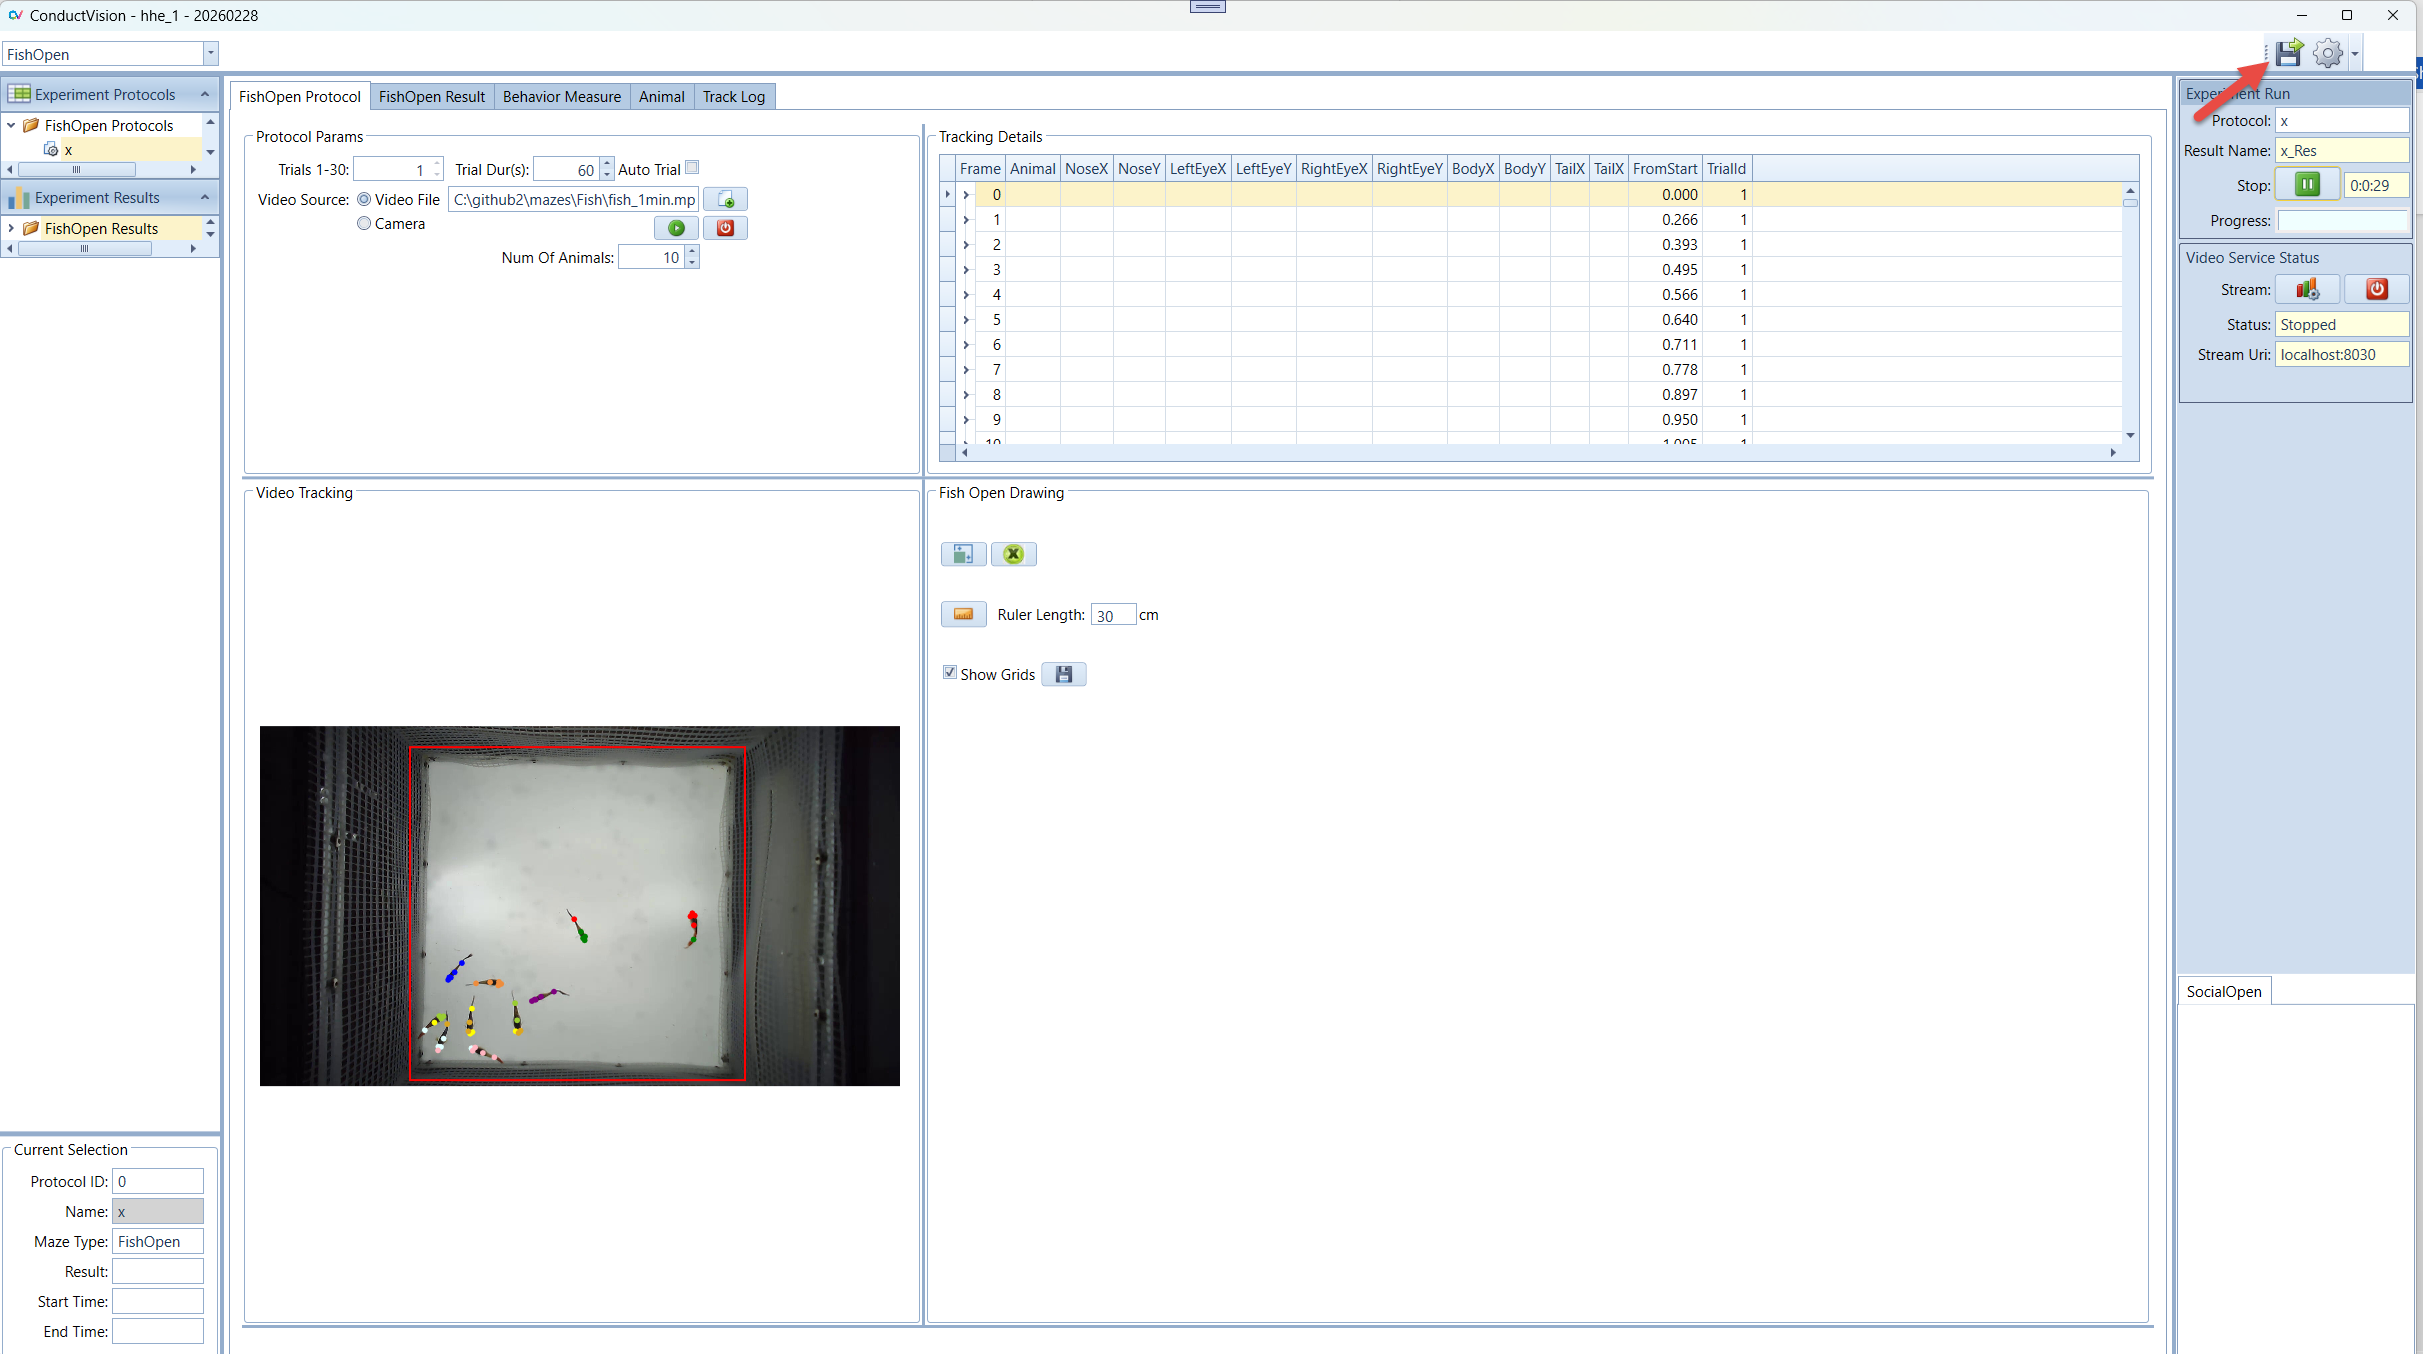
- Select a result
- Click the Export button
- The output file format is .csv
9. Troubleshooting
9.1 Log Display
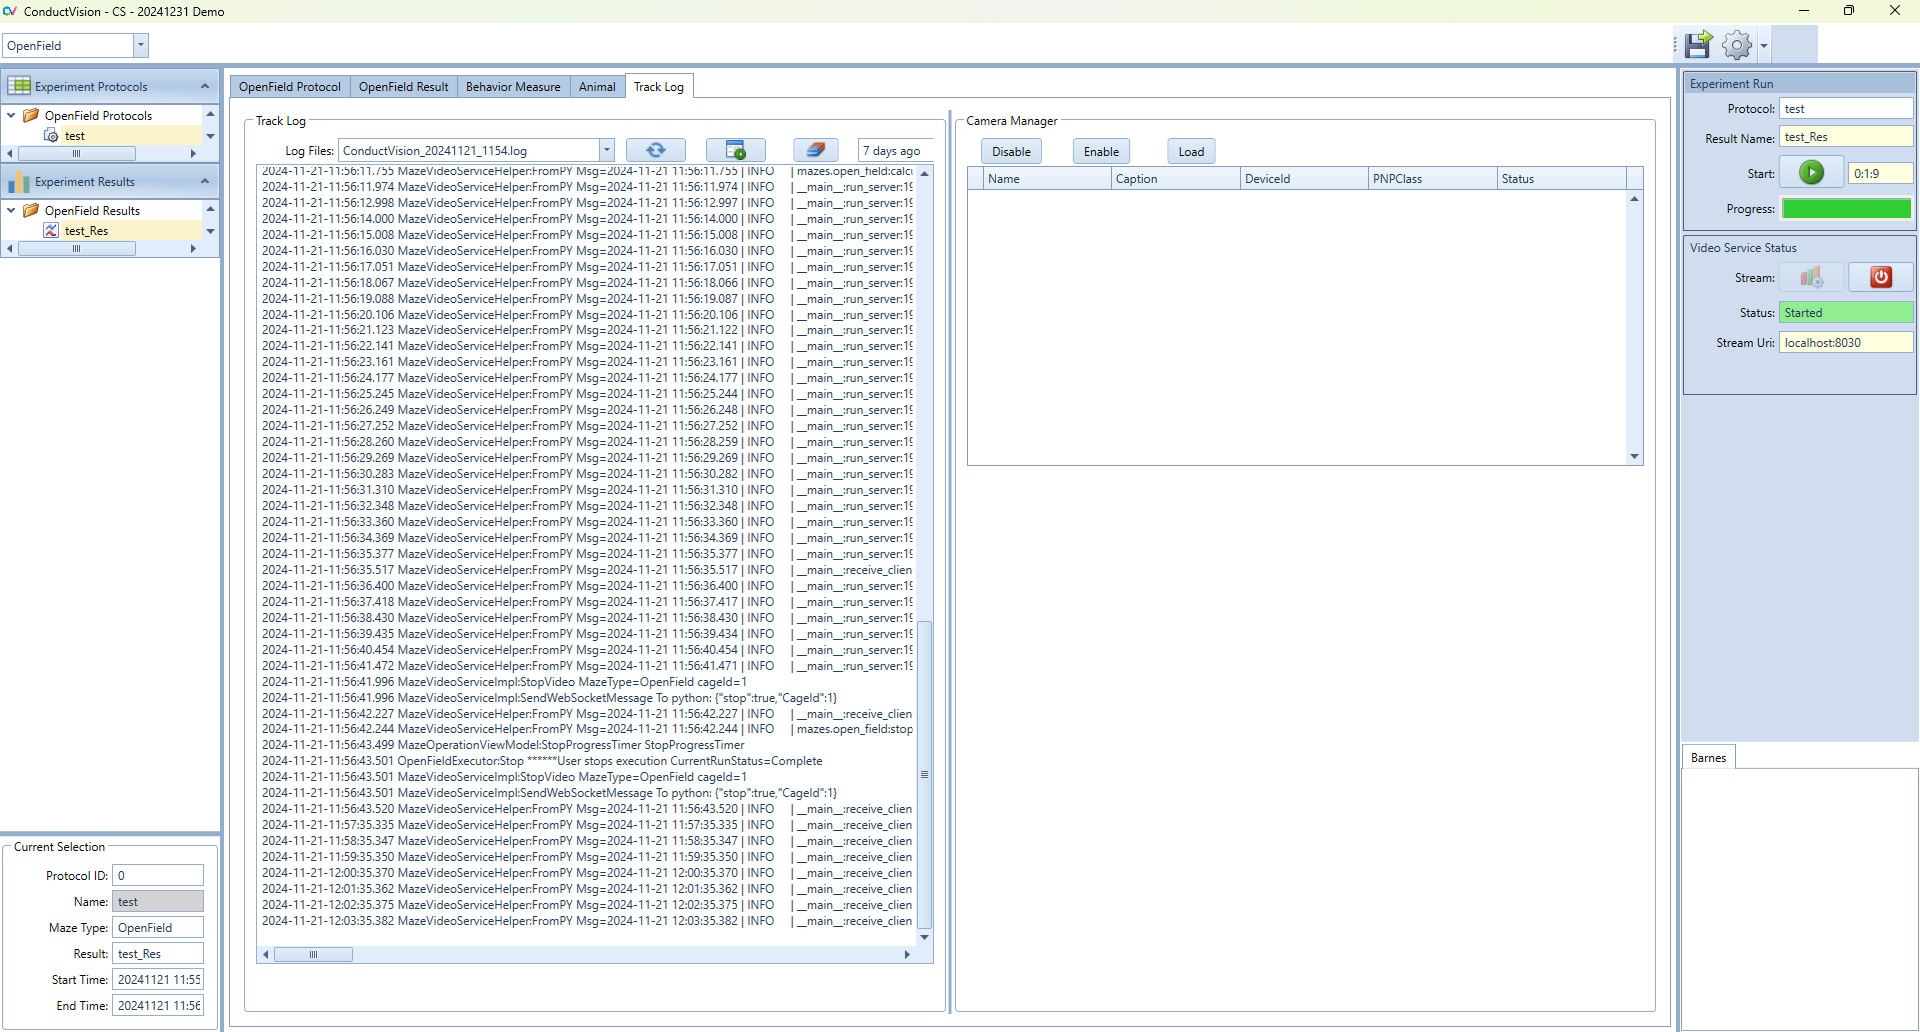
The log content can be displayed on the screen.
9.2 Database Files and User Data
The database file contains the protocols and results. There is a separate folder containing database files and video data for each maze under the bin folder.
10. Camera Setup
If one of our provided cameras is used, no drivers or software is required for the camera to function.
- Disable any other cameras on the computer under "Device Manager"
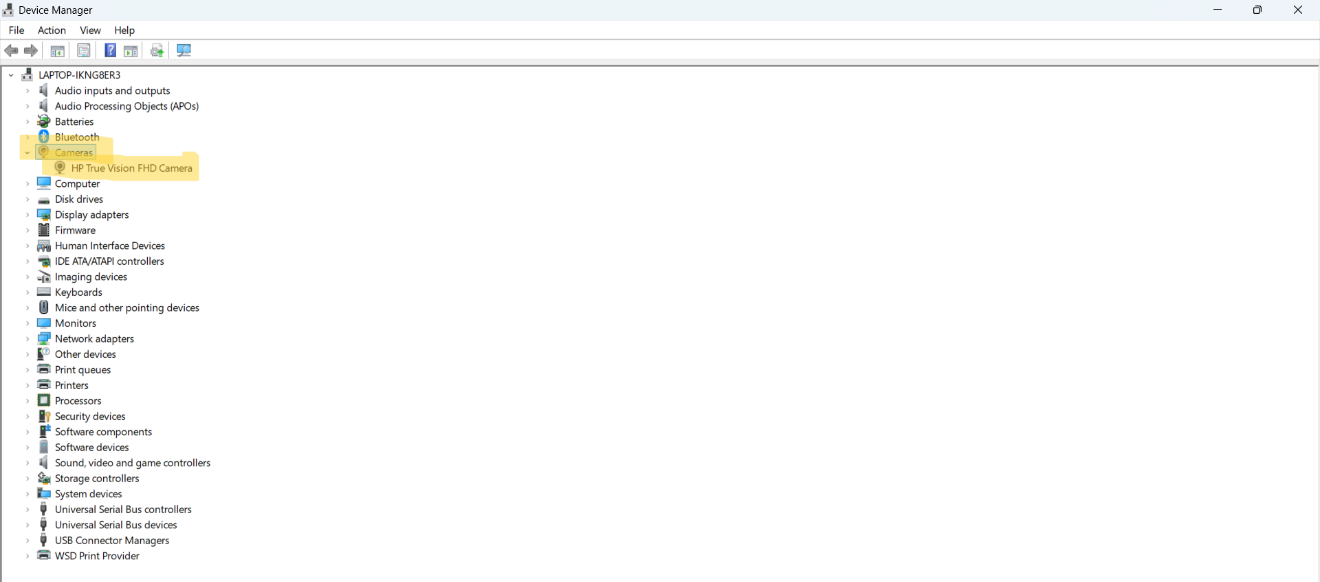
- Plug the camera into the computer's USB port. You should hear a noise to indicate the computer has recognized the camera.
- Open the computer's camera app to confirm the camera's connection and adjust the camera's view.
- Either record subject trials in advance using your computer's camera app or Open the ConductVision application for live streaming.